Overview
The Business Development Dashboard provides a high-level view of company and contact activity in Followup CRM.
Use this dashboard to monitor pipeline growth, track new records, review status distribution, and identify opportunities that require follow-up. The dashboard helps sales managers and business development teams quickly assess activity without reviewing individual records.
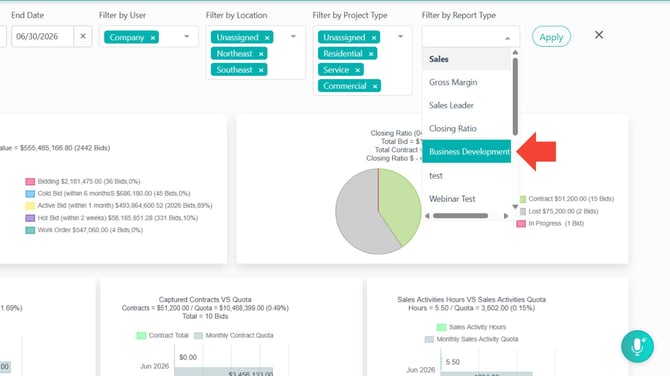
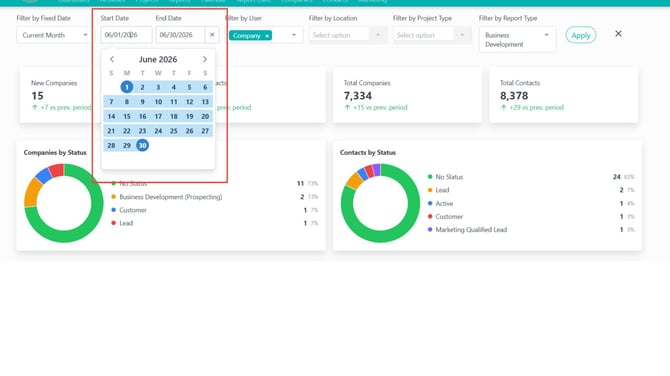
Step-by-Step Instructions📊 Step 1: Open the Business Development Dashboard- Navigate to the Dashboard or Reporting area
- Locate the Report Type dropdown.
- Select Business Development.
- Click Apply.
The dashboard will load company and contact activity based on your selected filters.
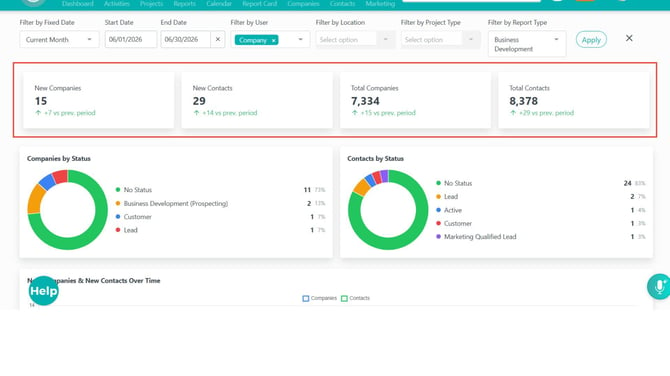
📈 Step 2: Review the KPI Strip
At the top of the dashboard, review the key performance indicators:
New Companies
Companies added during the selected time period.
New Contacts
Contacts added during the selected time period.
Total Companies
Total companies available based on the selected filters.
Total Contacts
Total contacts available based on the selected filters.
Each KPI includes a comparison against the previous period to help identify growth trends.
🏢 Step 3: Review Companies by Status
Use the Companies by Status chart to see how companies are distributed throughout your business development process.
This chart helps identify:
- Pipeline concentration
- Stalled opportunities
- Areas requiring additional follow-up
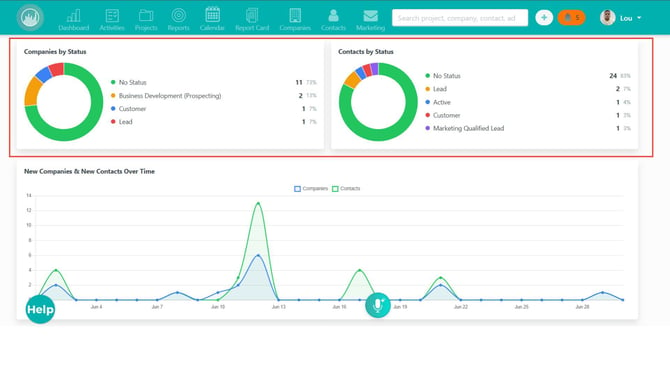
👥 Step 4: Review Contacts by Status
Use the Contacts by Status chart to review the current status of contact records.
This provides visibility into:
- Contact engagement
- Prospect progression
- Follow-up opportunities
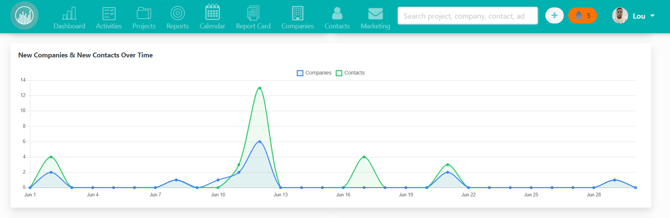
📉 Step 5: Review the Trend Graph
Use the trend graph to monitor new company and contact activity over time.
Look for:
- Growth trends
- Activity spikes
- Slow periods
- Declines in new record creation
This information helps measure business development momentum.
📋 Step 6: Review New Companies and New Contacts
The dashboard includes recent activity lists for:
New Companies
Review information such as:
- Company Name
- Industry
- Date Added
- Current Status
New Contacts
Review information such as:
- Contact Name
- Associated Company
- Date Added
- Current Status
Use these lists to prioritize outreach and follow-up activities.
🔎 Step 7: Apply Dashboard Filters
Use the filter bar to narrow dashboard results.
Common filters include:
- Date Range
- Fixed Date Range
- User / Owner
The User / Owner filter is useful when reviewing activity for a specific team member.
⚠️ Note: Office and Contract Type filters may be unavailable because this dashboard focuses on company and contact activity rather than project reporting.
🛠️ Step 8: Troubleshoot Empty or Unexpected Results
If the dashboard appears empty or activity seems lower than expected:
- Expand the selected date range
- Clear the User / Owner filter
- Confirm companies or contacts were added during the selected period
- Verify records have statuses assigned
- Confirm you have permission to view the dashboard data
Dashboard results are based on filters, permissions, and available company and contact records.
ResultYou can now use the Business Development Dashboard to monitor company and contact activity, track pipeline growth, identify trends, and prioritize outreach efforts more effectively.
Best Practices💡 Review the dashboard during daily or weekly sales meetings.
💡 Monitor period-over-period KPI changes to identify momentum shifts.
💡 Use the User / Owner filter for rep-specific performance reviews.
💡 Prioritize outreach using the New Companies and New Contacts lists.
💡 Expand the date range if activity appears lower than expected.
💡 Keep company and contact statuses updated to improve reporting accuracy.
Happy Selling!