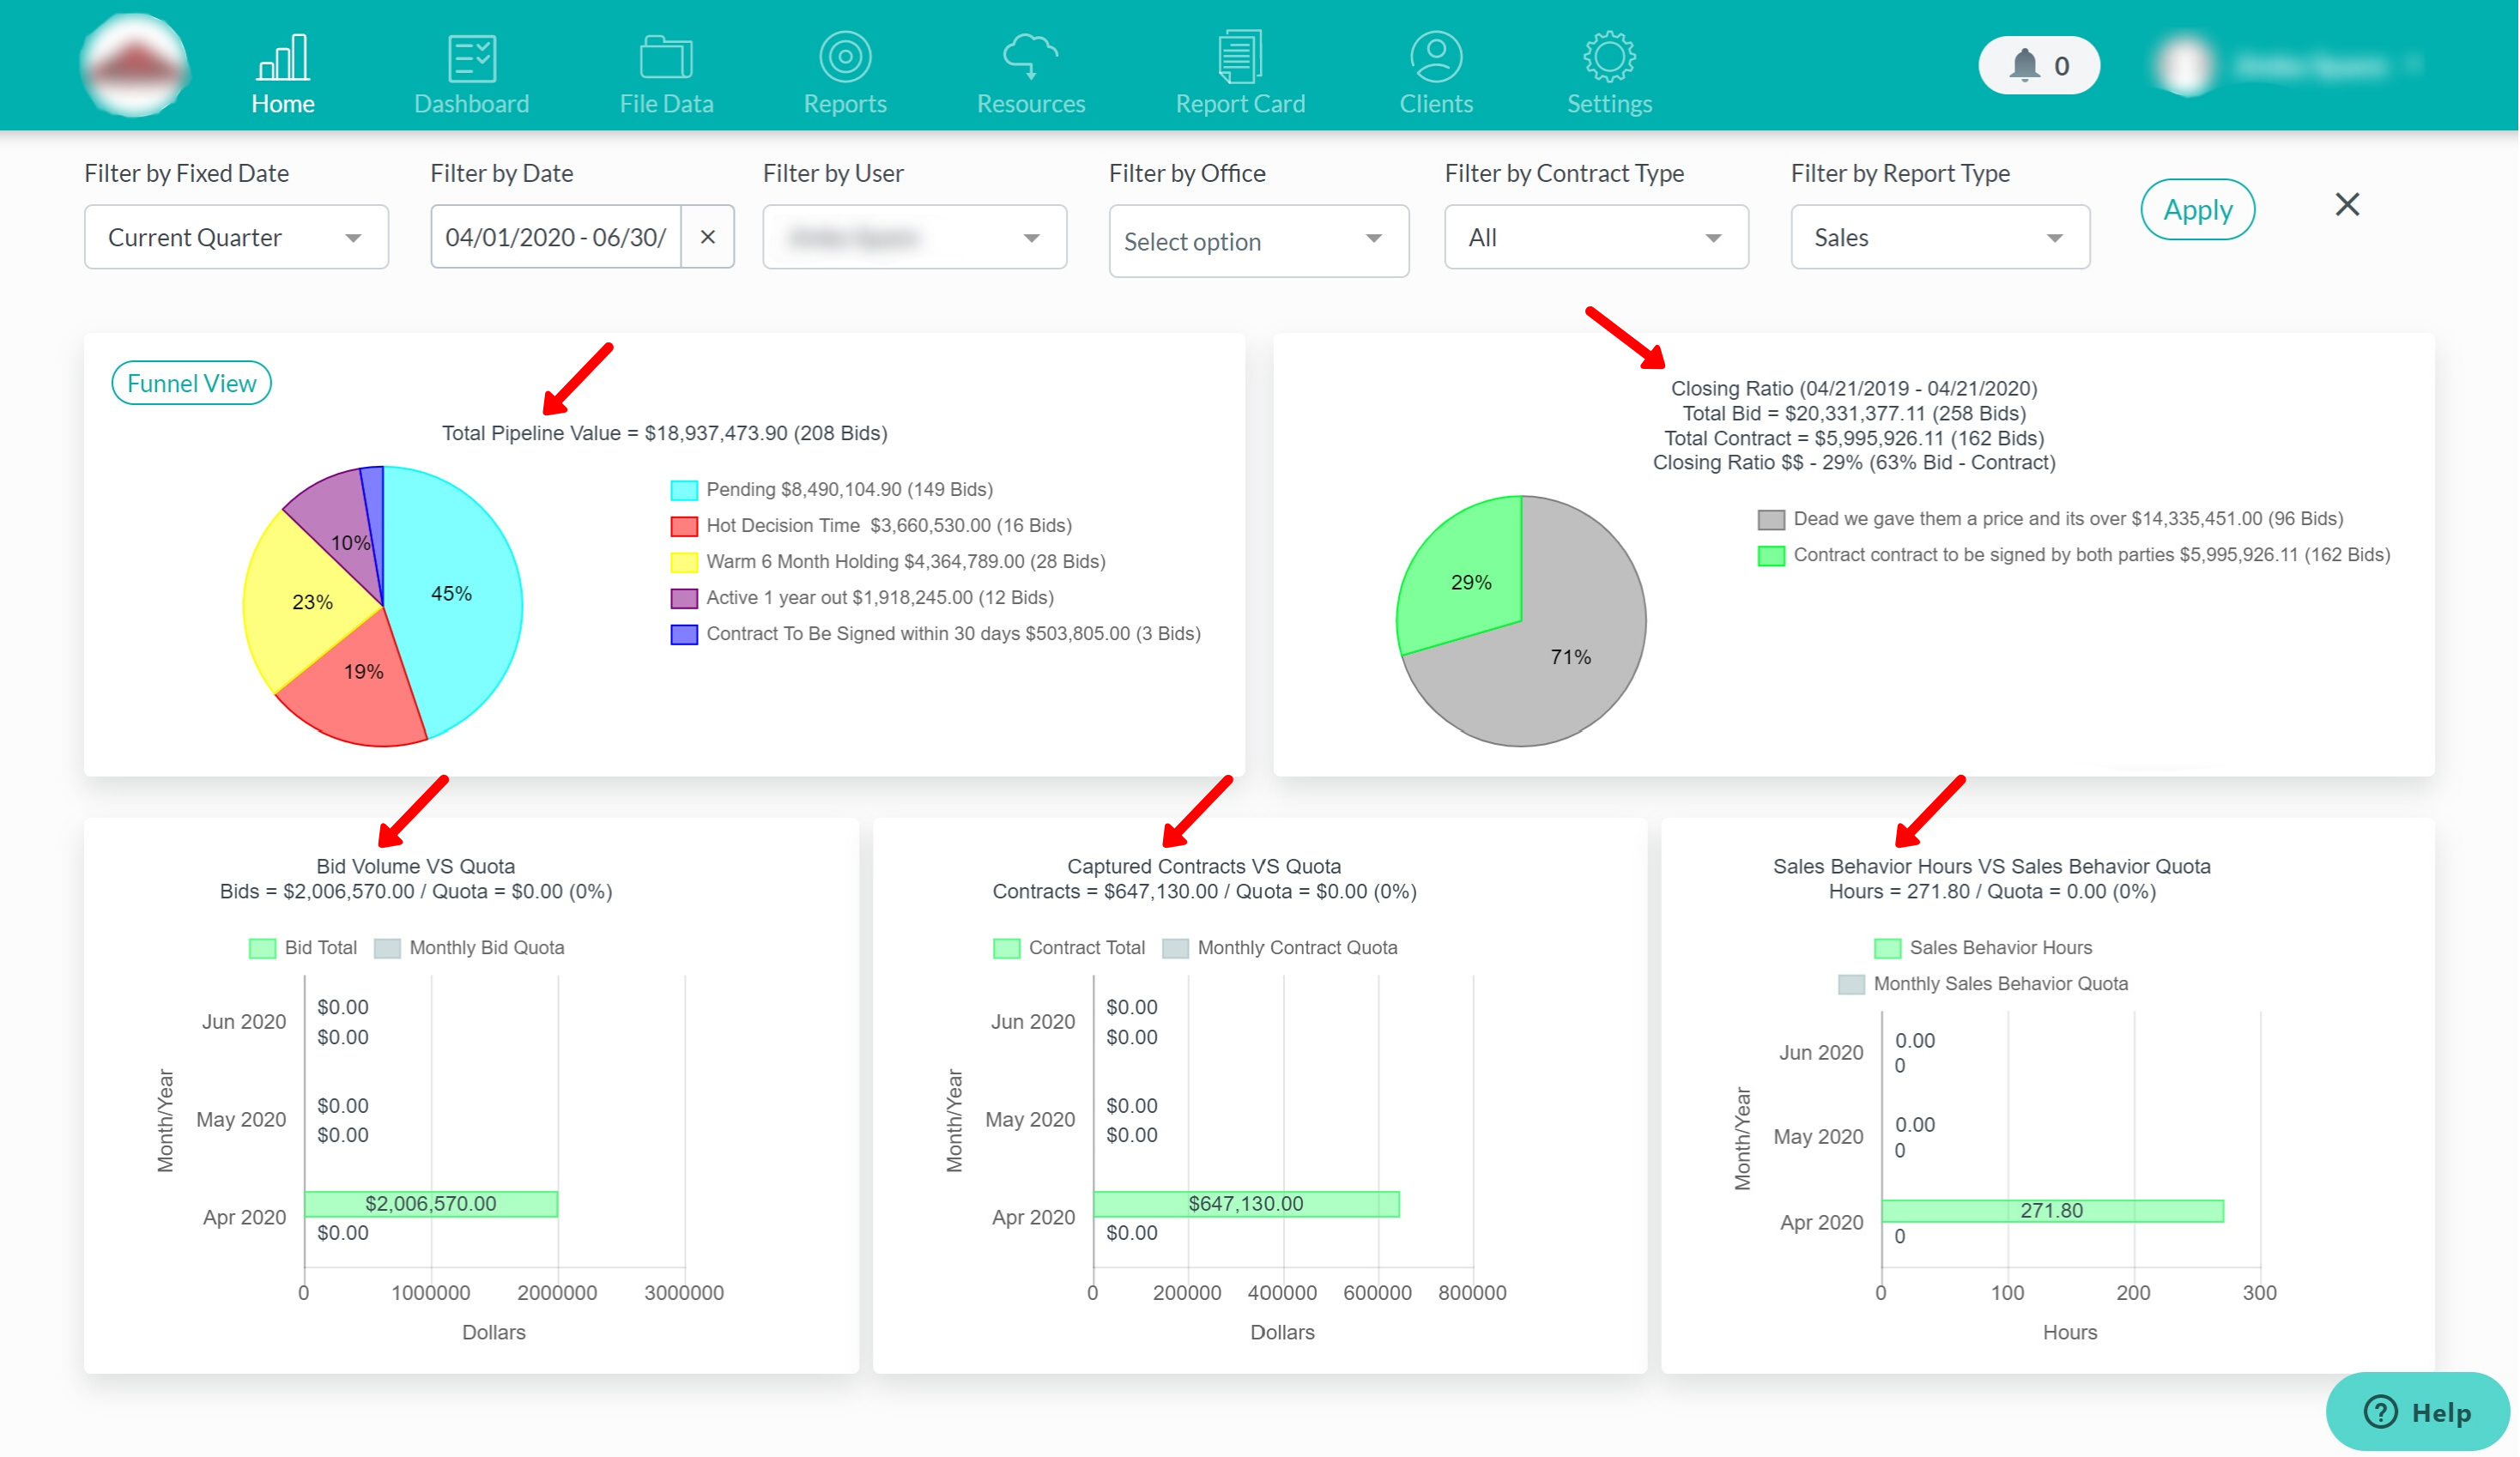
The Followup CRM homepage gives you an overall picture of the pipeline, closing ratio, bid volume, capture contracts, and your sales behavior hours.
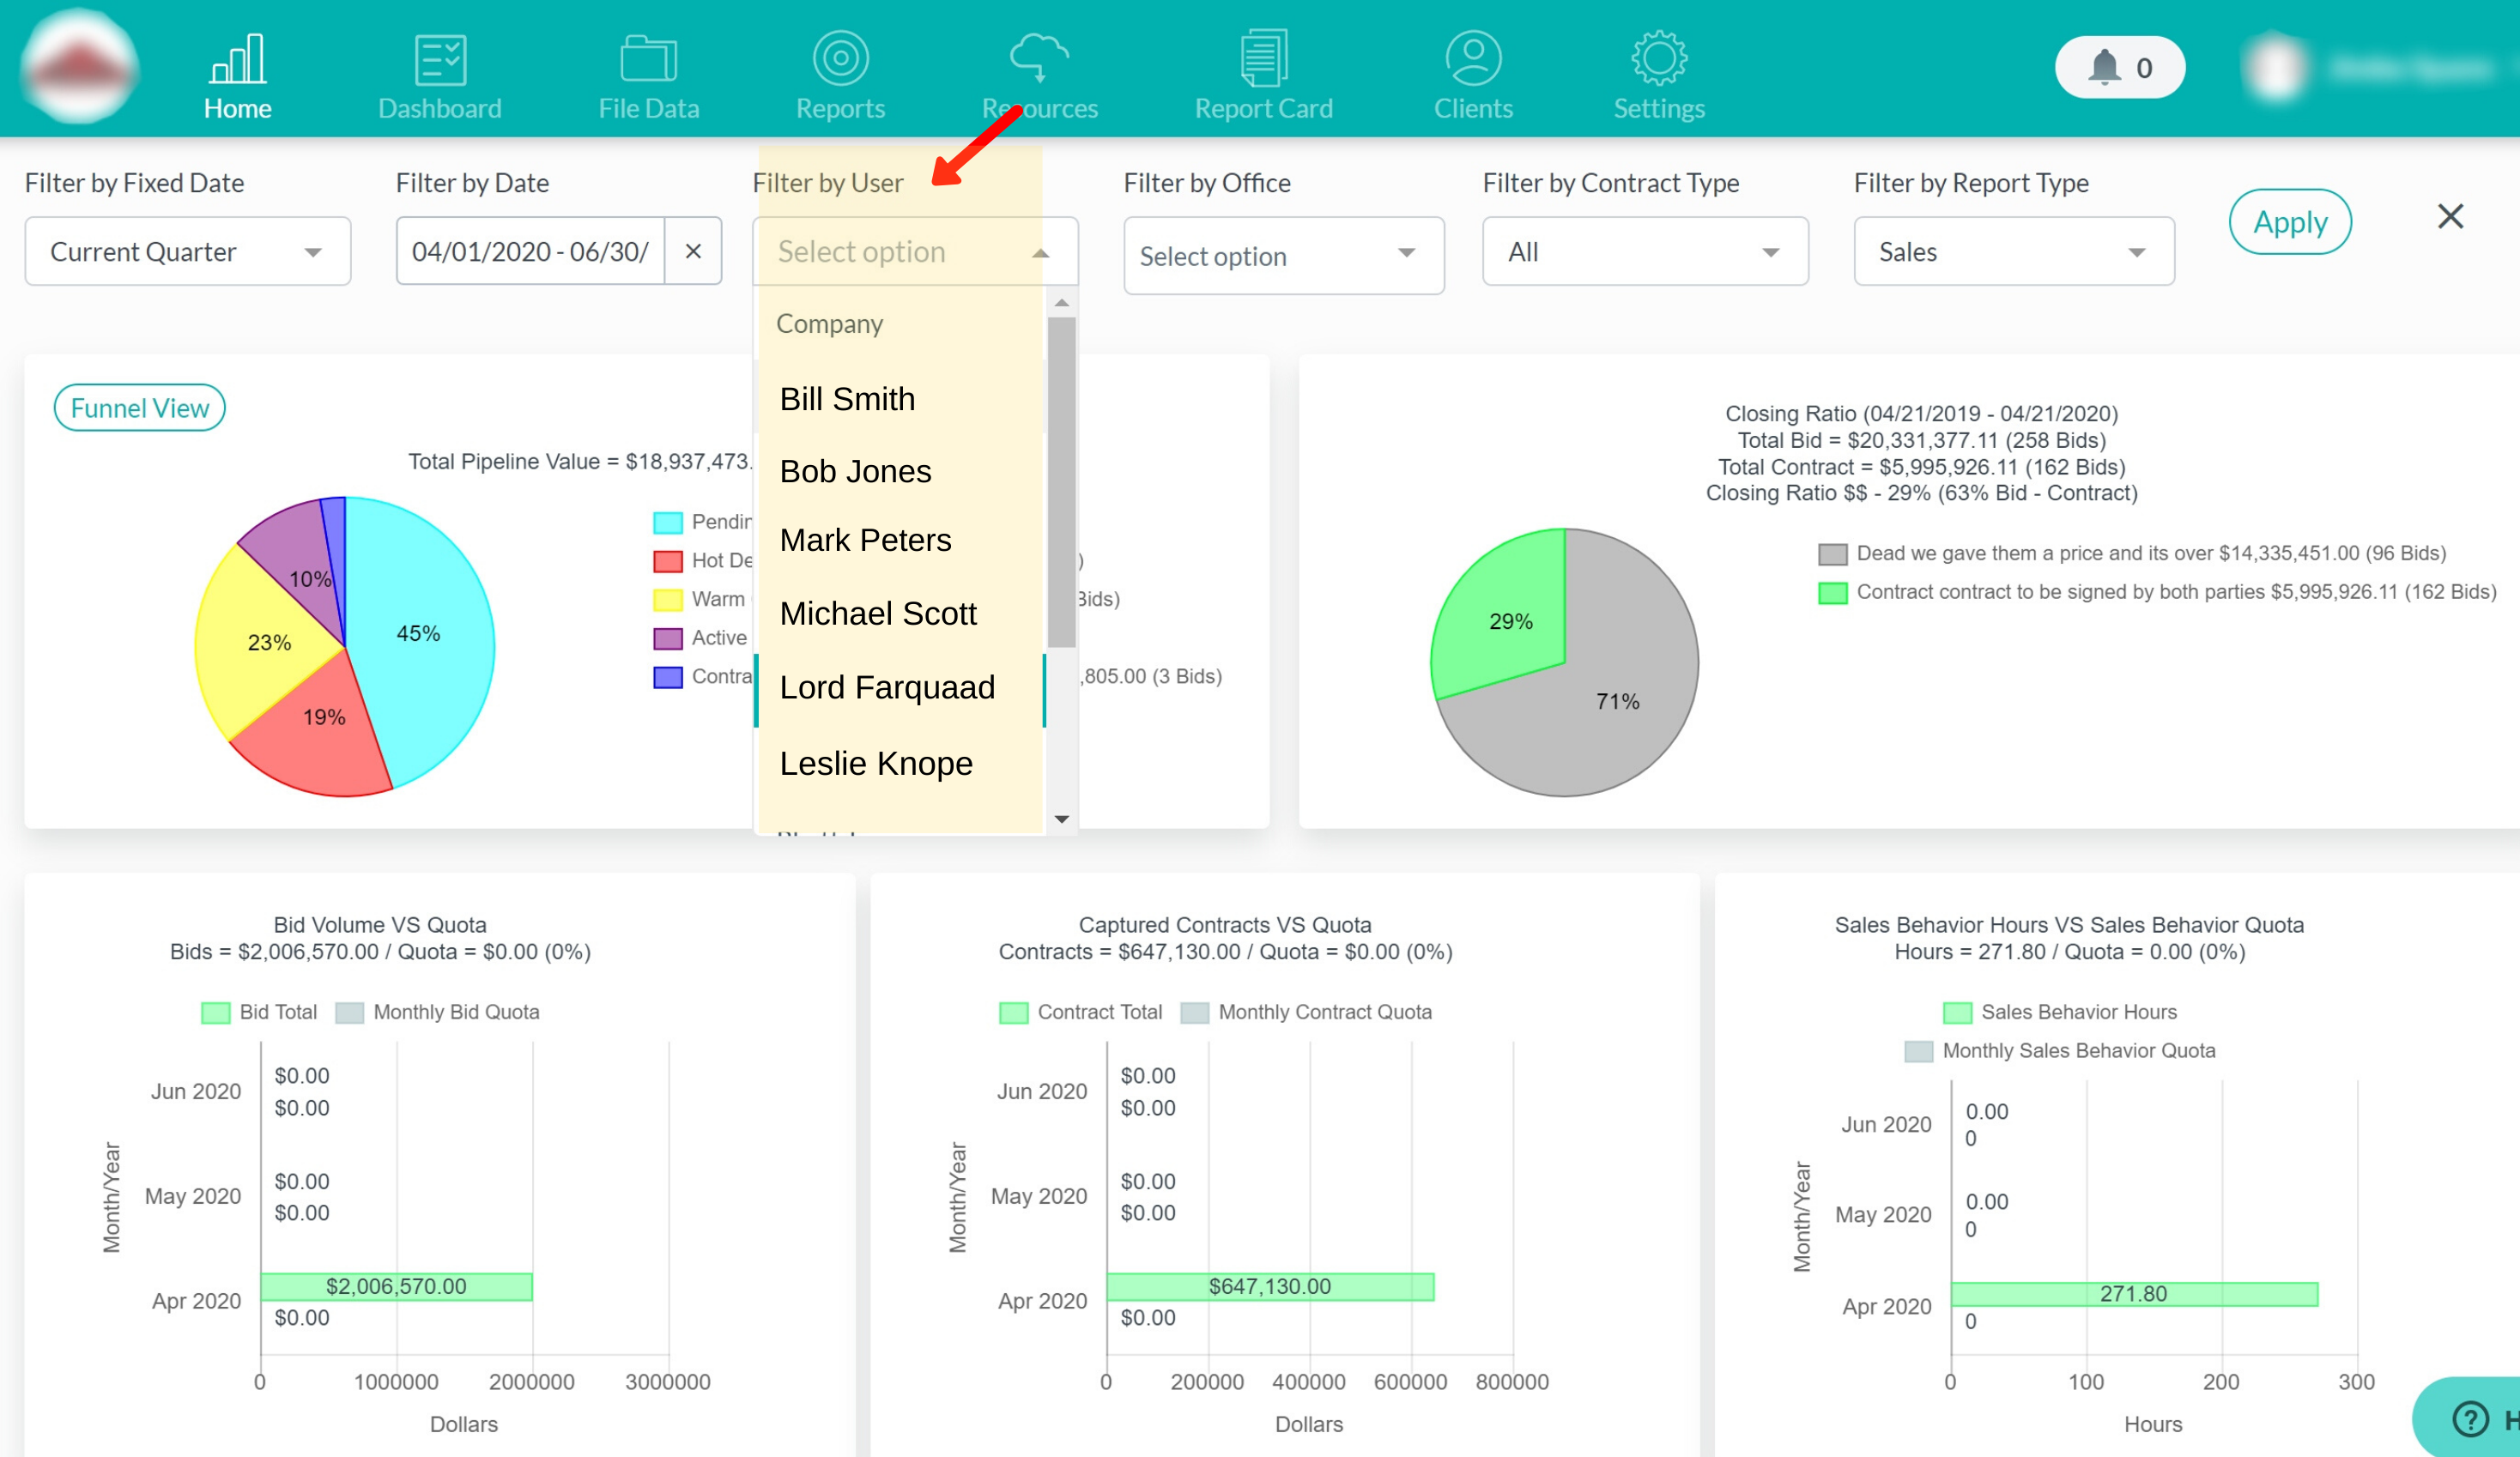
You have the option to look at the homepage data from a company perspective (which would be an administrator, senior manager, owner of a company, etc.). You can also filter this by specific user by selecting the individual’s name in the dropdown.
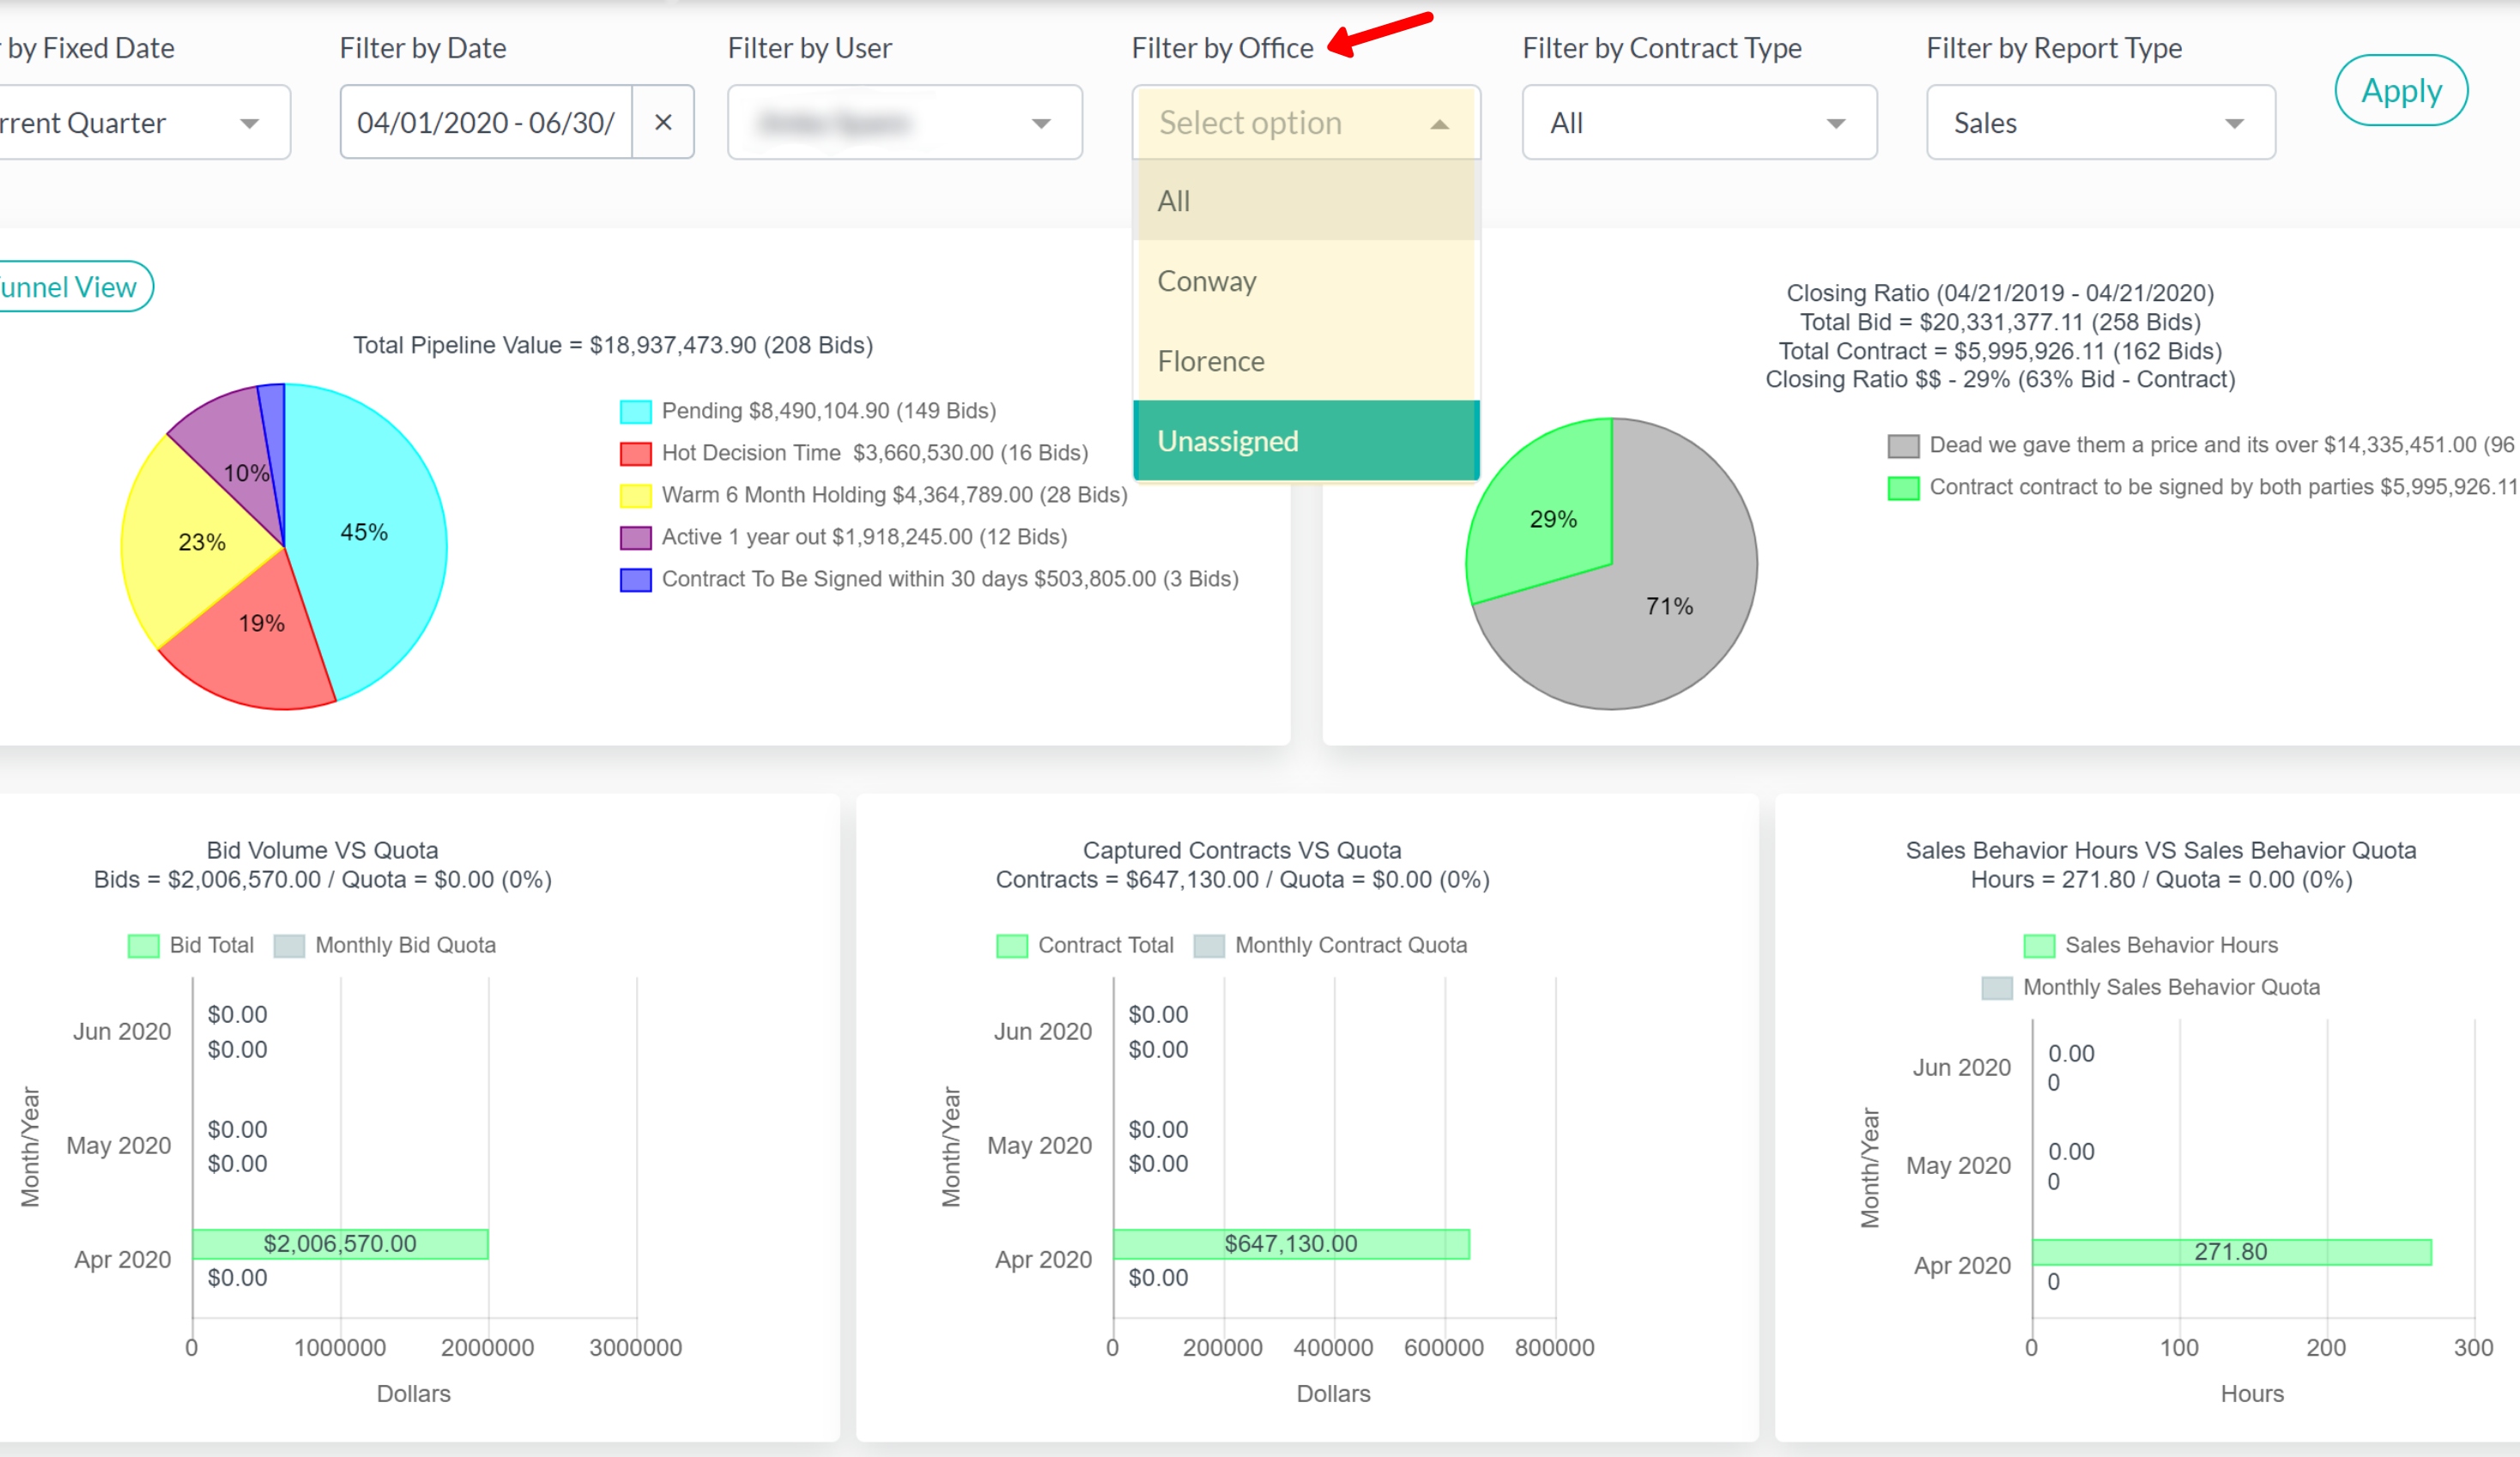
If you have multiple office locations, you can also filter the data by office in the dropdown as well as by contract type.
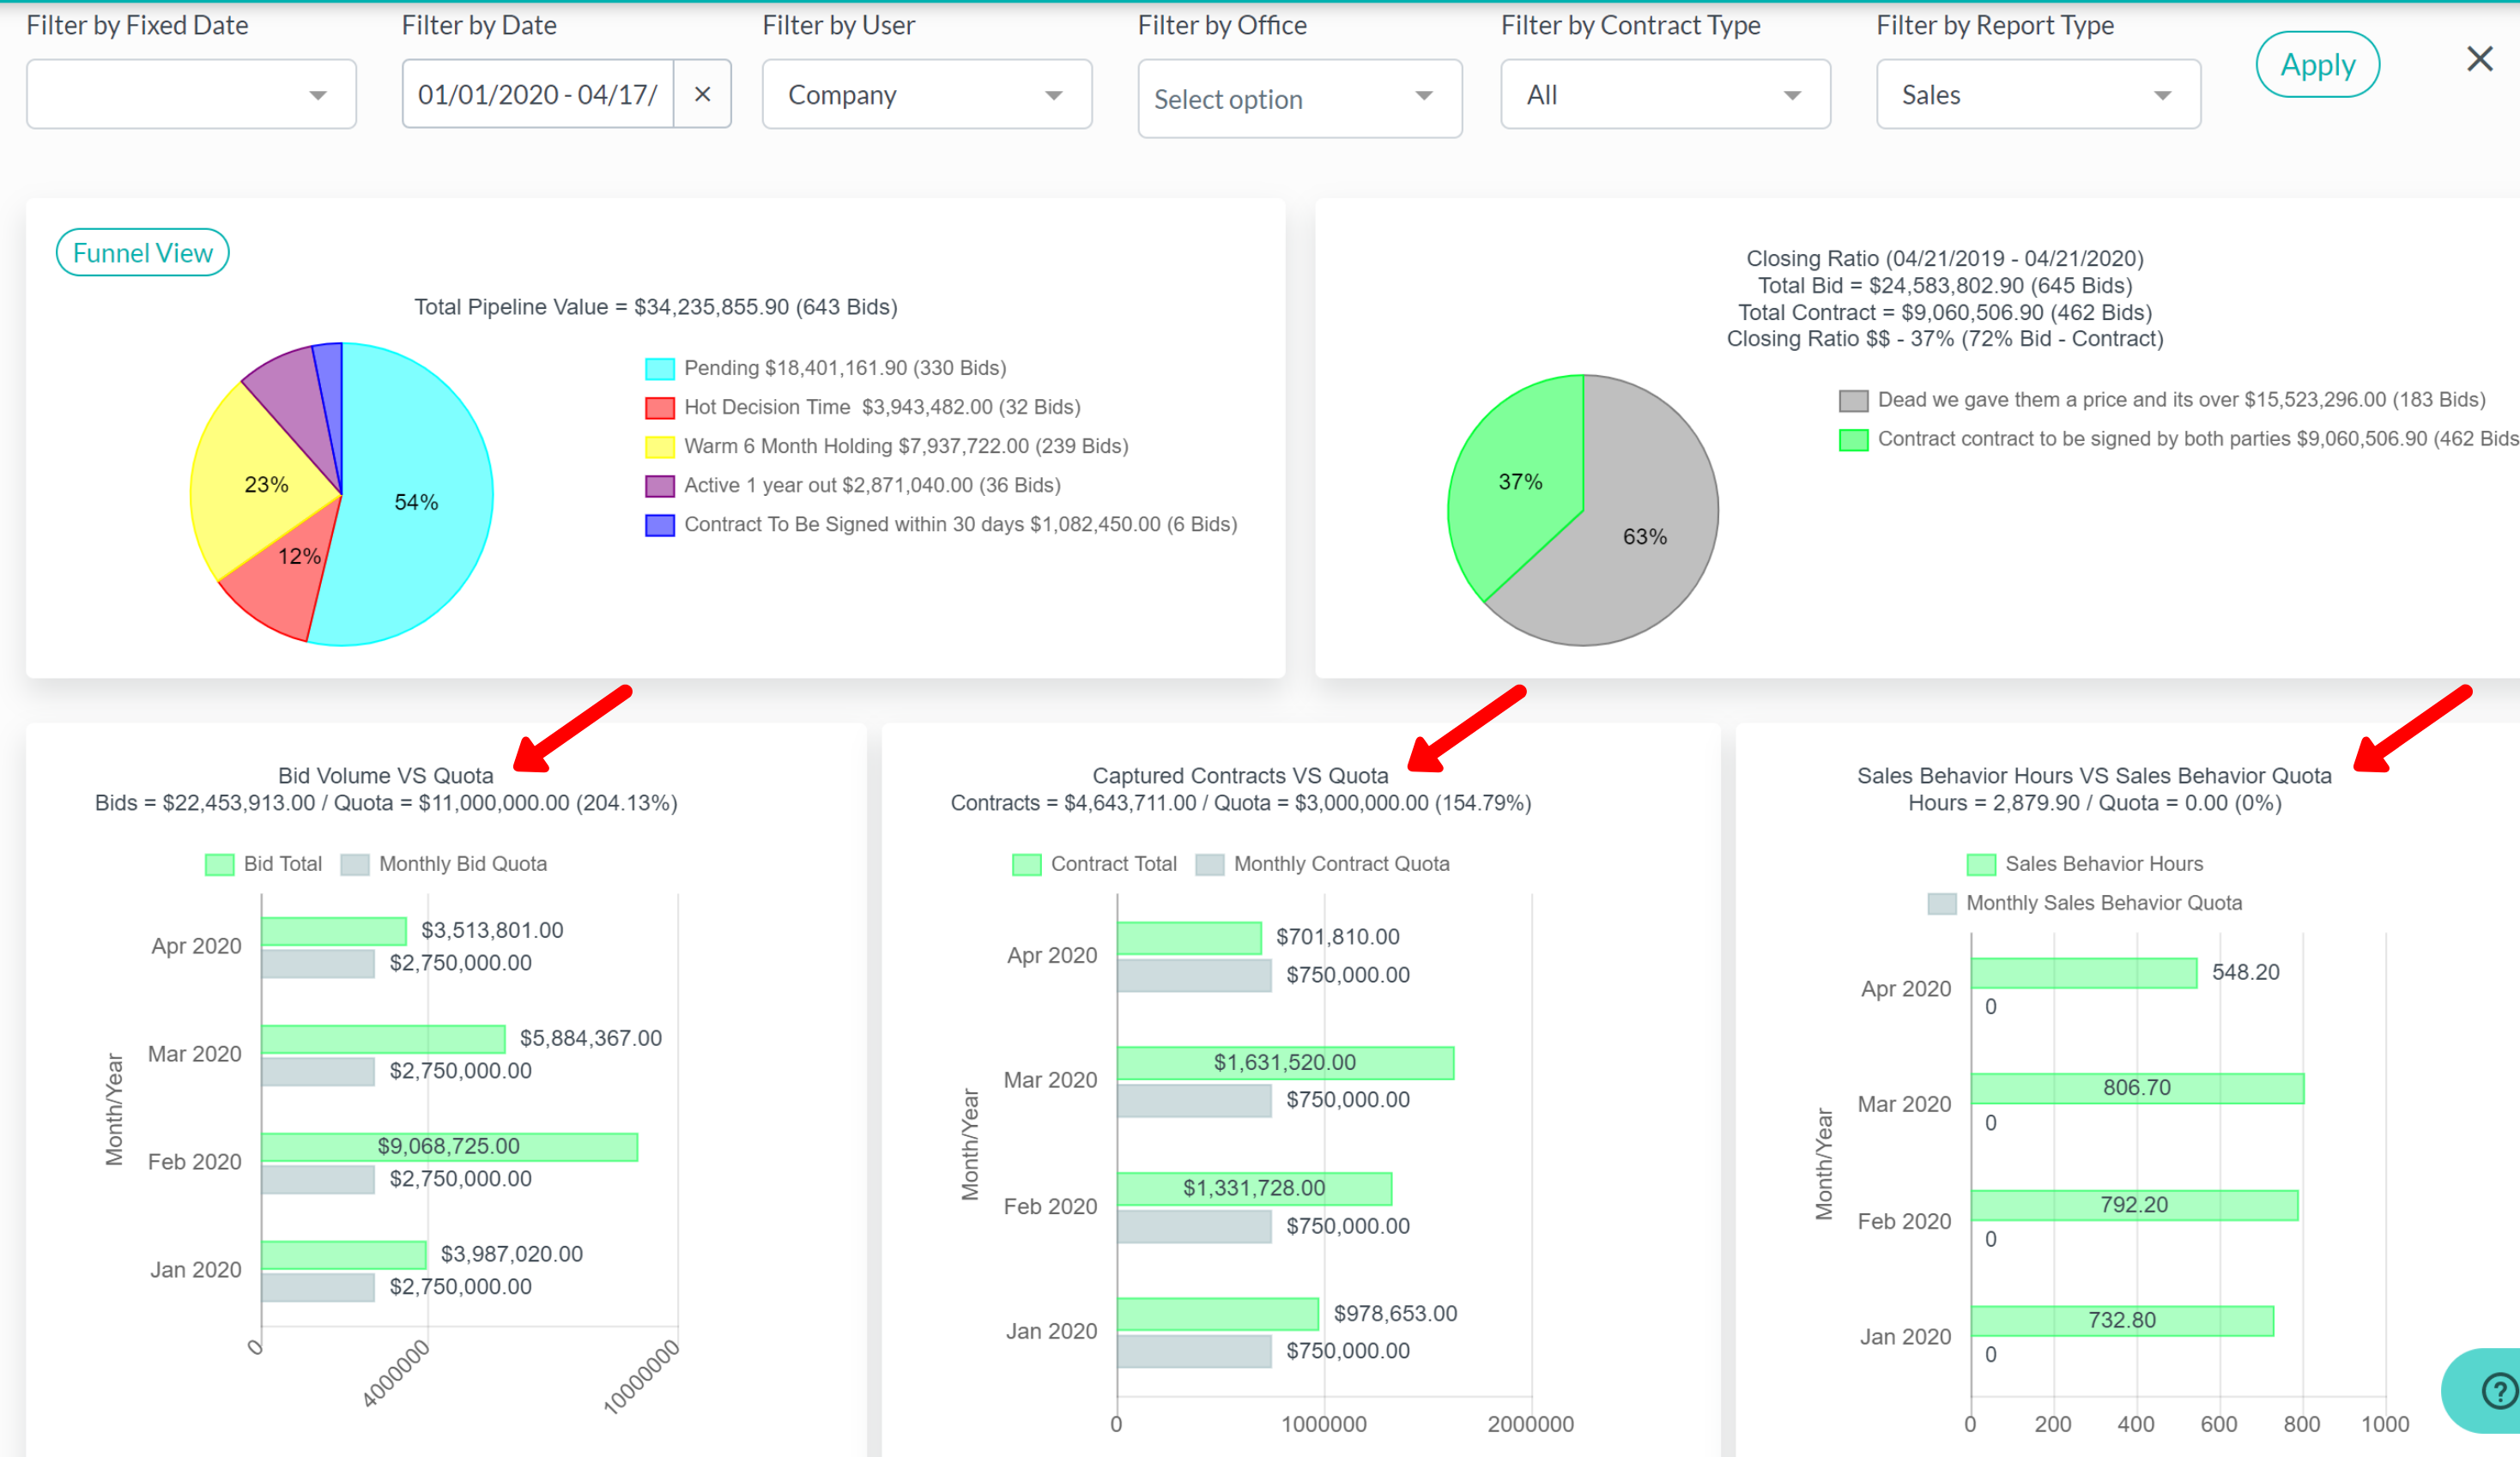
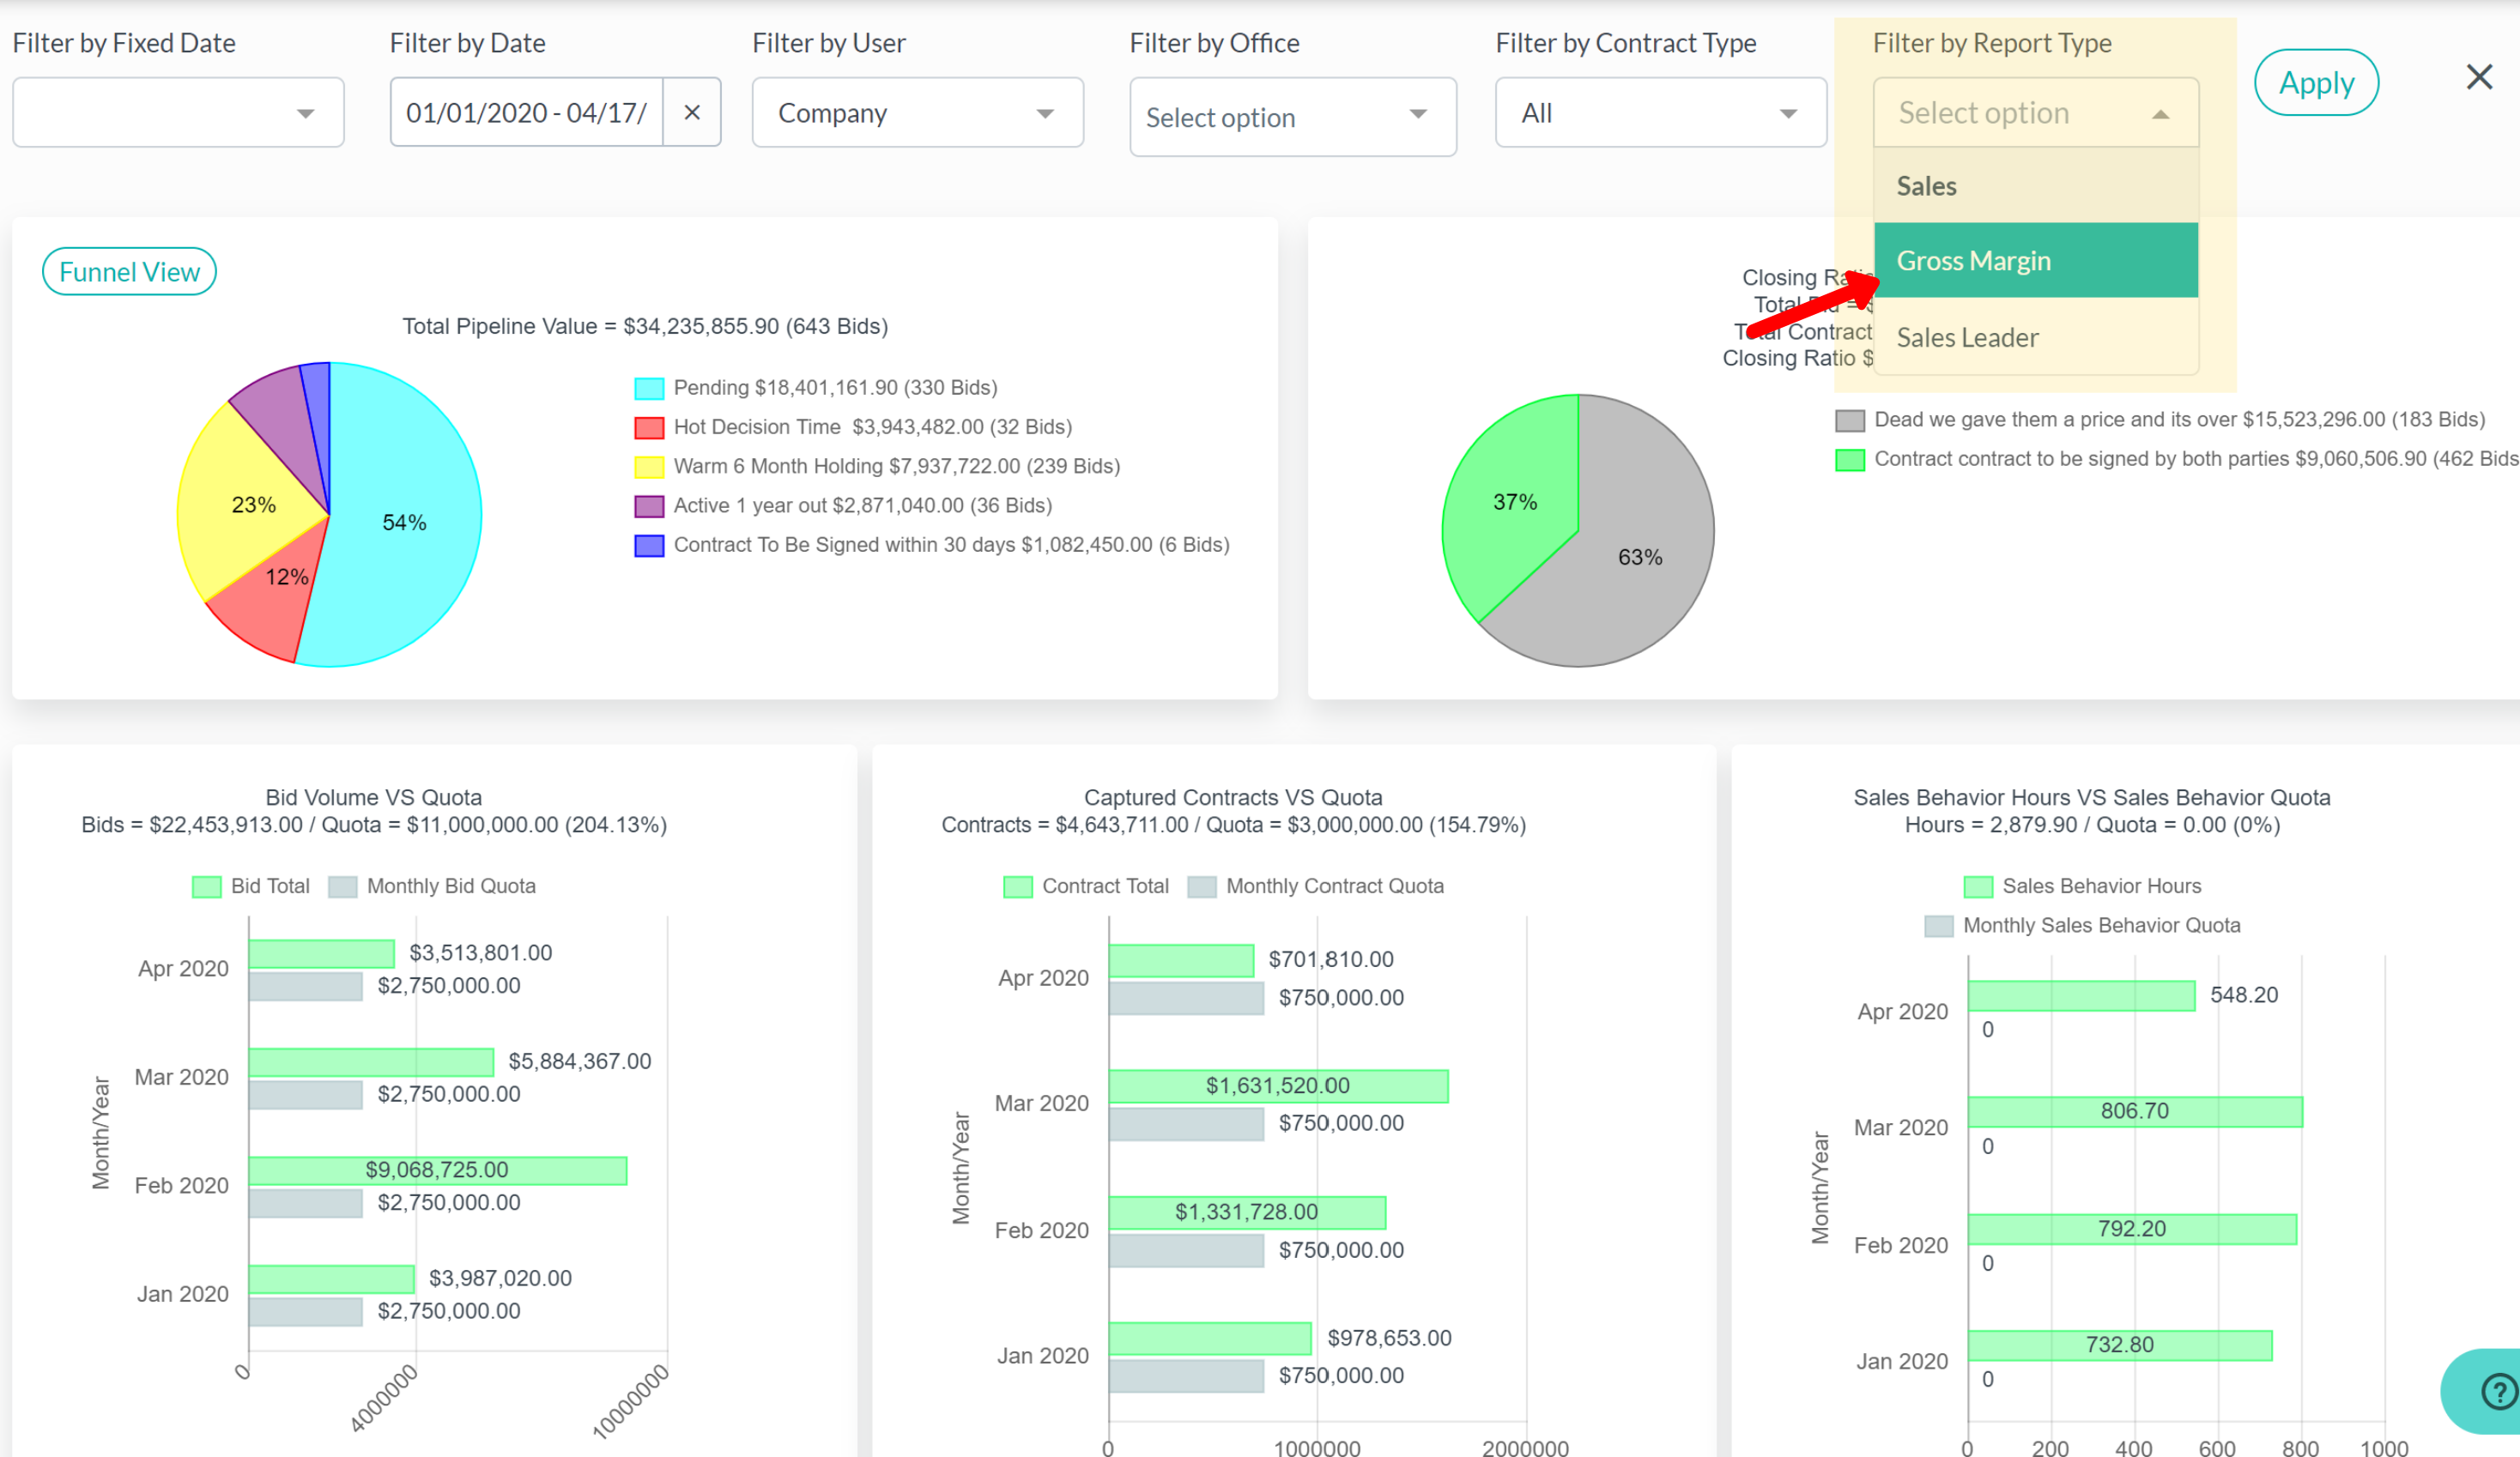
The pipeline on the top left shows you the total value. It shows you everything that's been bid and that hasn't been won or lost. In the example below, you can see they have 643 bids representing 34 million, which has been classified into these different areas. In this example, they have a bunch of bids in pending. We strongly advise users to not classify bids as pending because if you classify bids as pending, you don't have a timeline idea of when you think they might be won or lost.
A best practice when delivering a proposal is to ask the question, “when can I follow up with you” and “when are you making a decision on this,” and then based on that response, you classify it in your pipeline with a timeline based sales status.
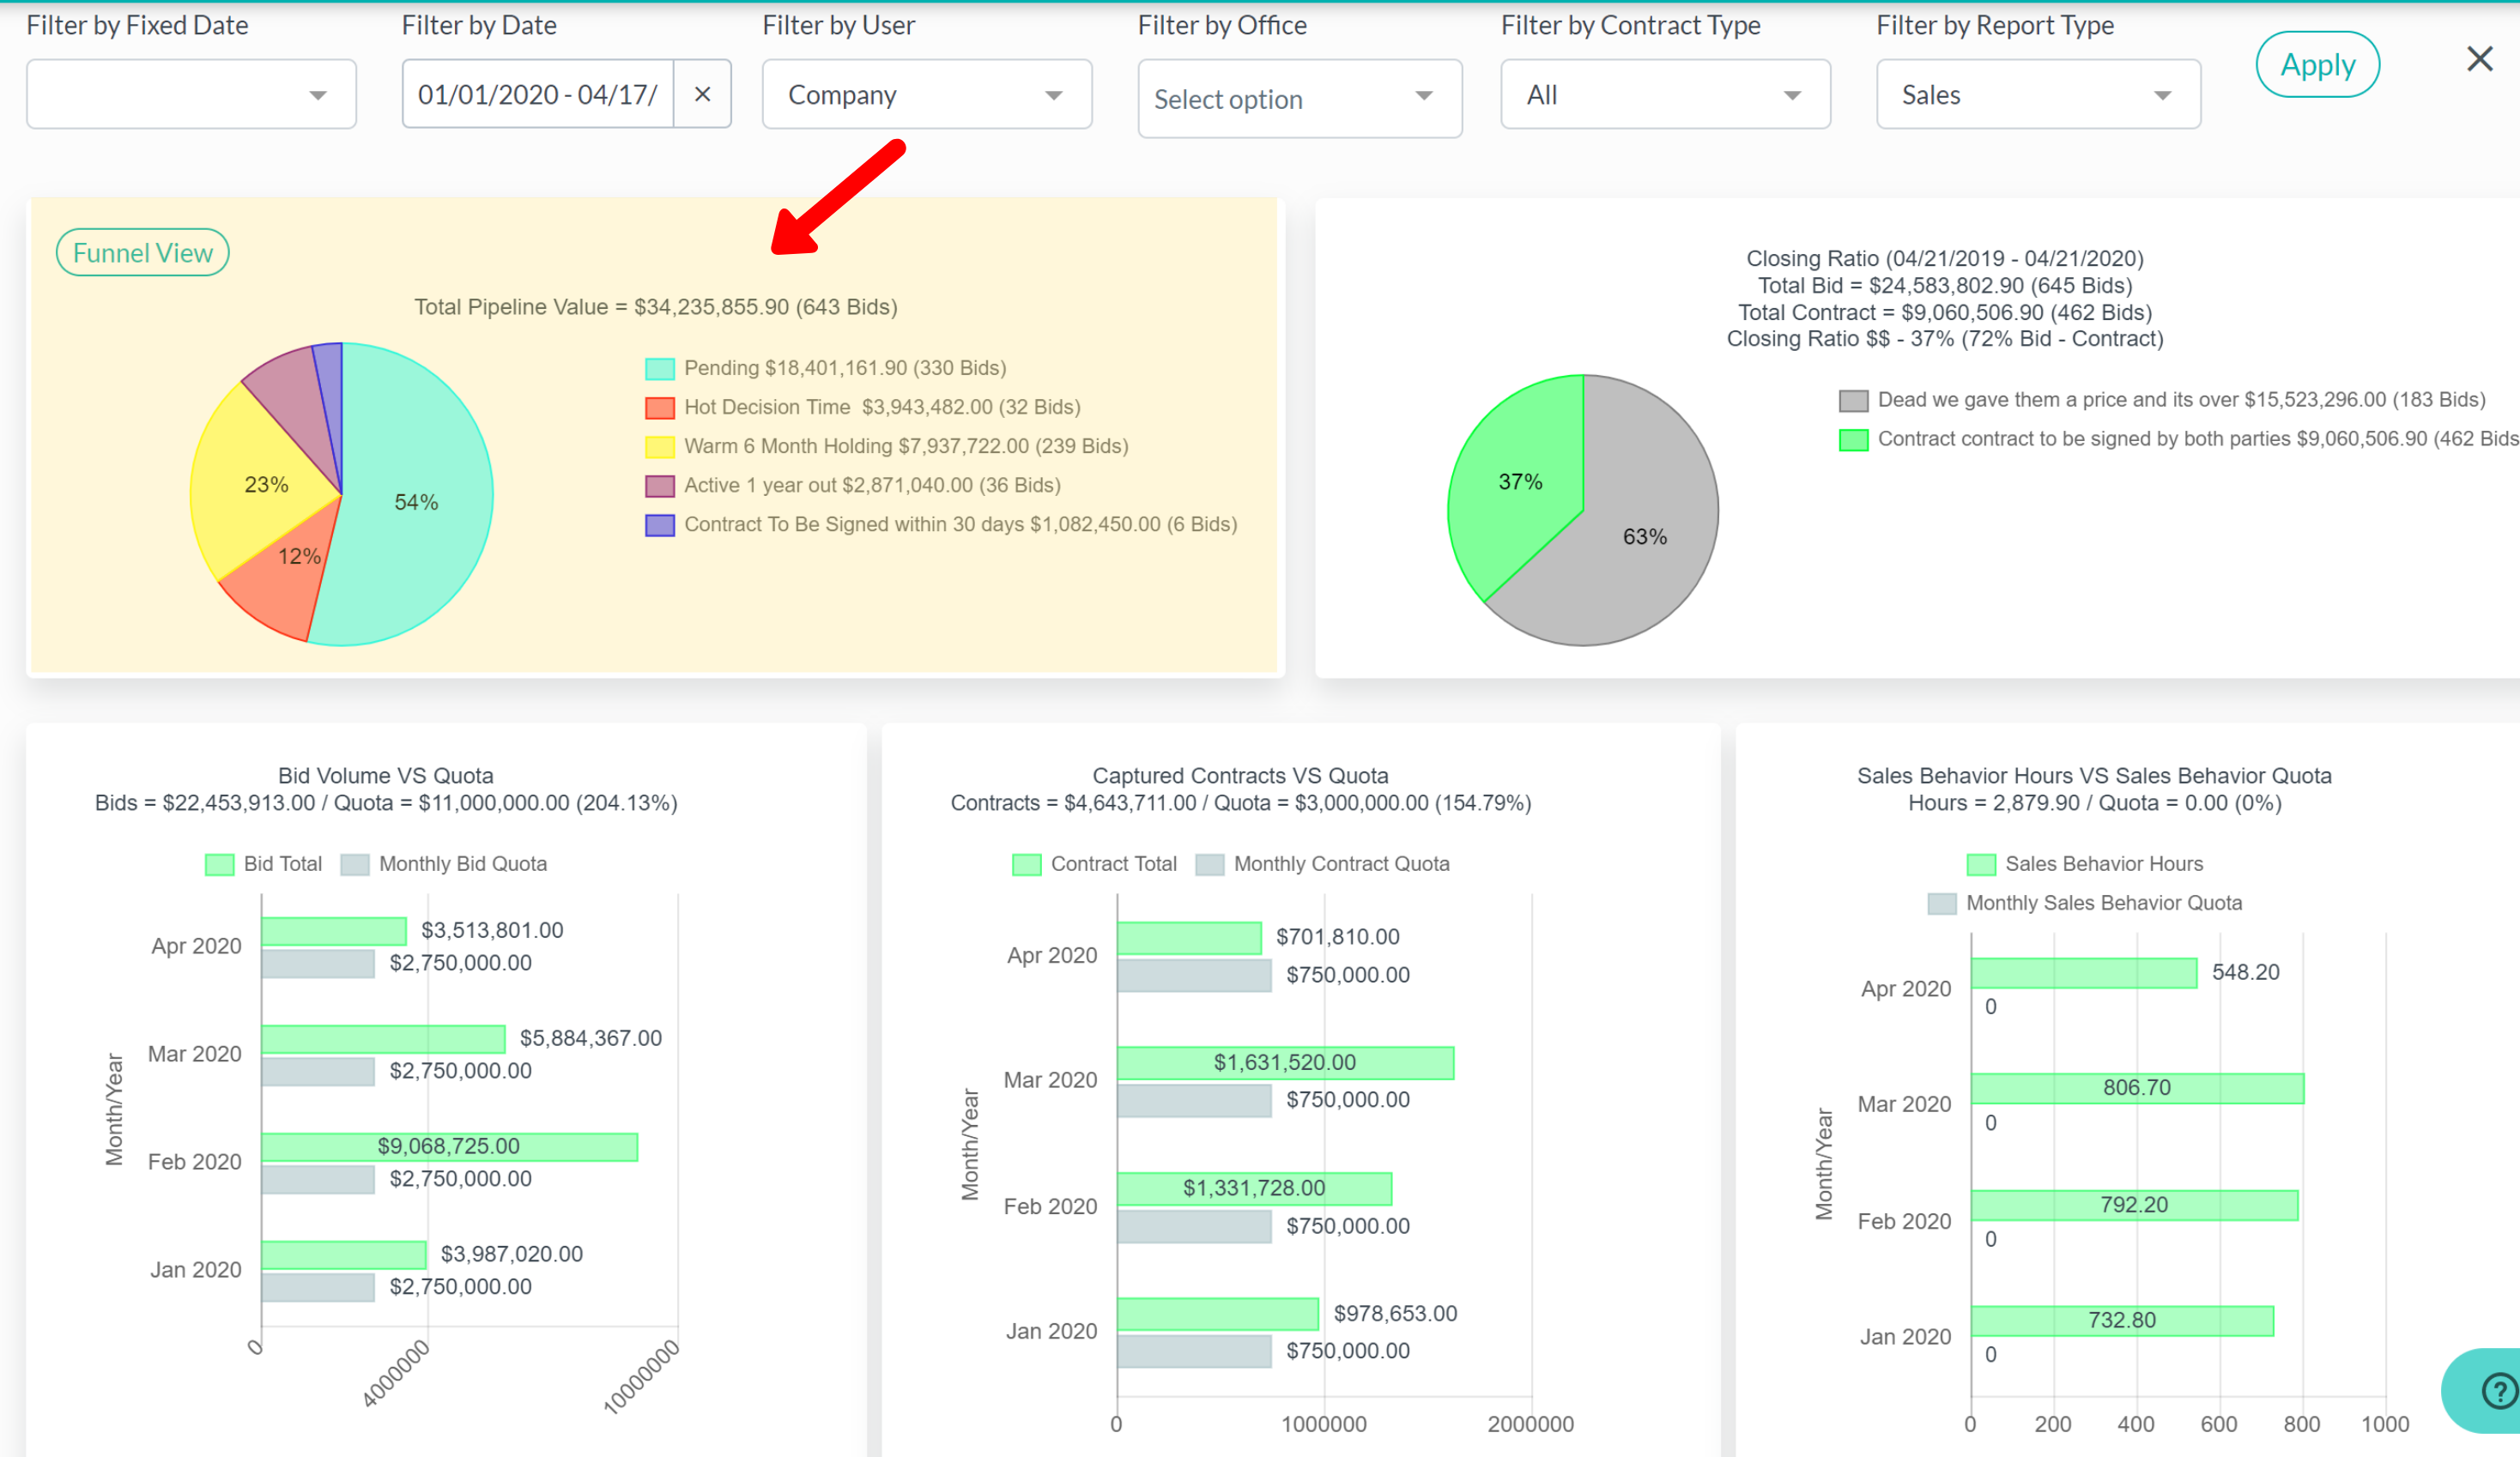
For example, if you deliver a proposal and they say they're making a decision in the next 30 to 60 days, we classify that as a “hot” decision. A “warm” decision is within the next six months. “Active” is a decision that’s being made within the next year. “Contract to be signed” or “verbal commitment” means that they've given you a verbal commitment and are moving forward with your project, but it doesn't count as a contract until it's a contract. Until it's signed, it doesn't move to your closing ratio. It stays in your pipeline. If you classify your pipeline this way, you have an idea of when you think things might be won or lost. If you don't classify it this way and everything's in pending, you have $18,000,000 there but you don't have any idea of when those proposals can be won or lost but if you look at “hot” and you have 3.8 million, you know that 3.8 million is going to be won or lost in the next 30 to 60 days. Then based on your closing ratio of 37%, you know you’ll likely close 37% of that. Classifying your bids in these timeline-based categories helps you better project how much revenue you may close and when.
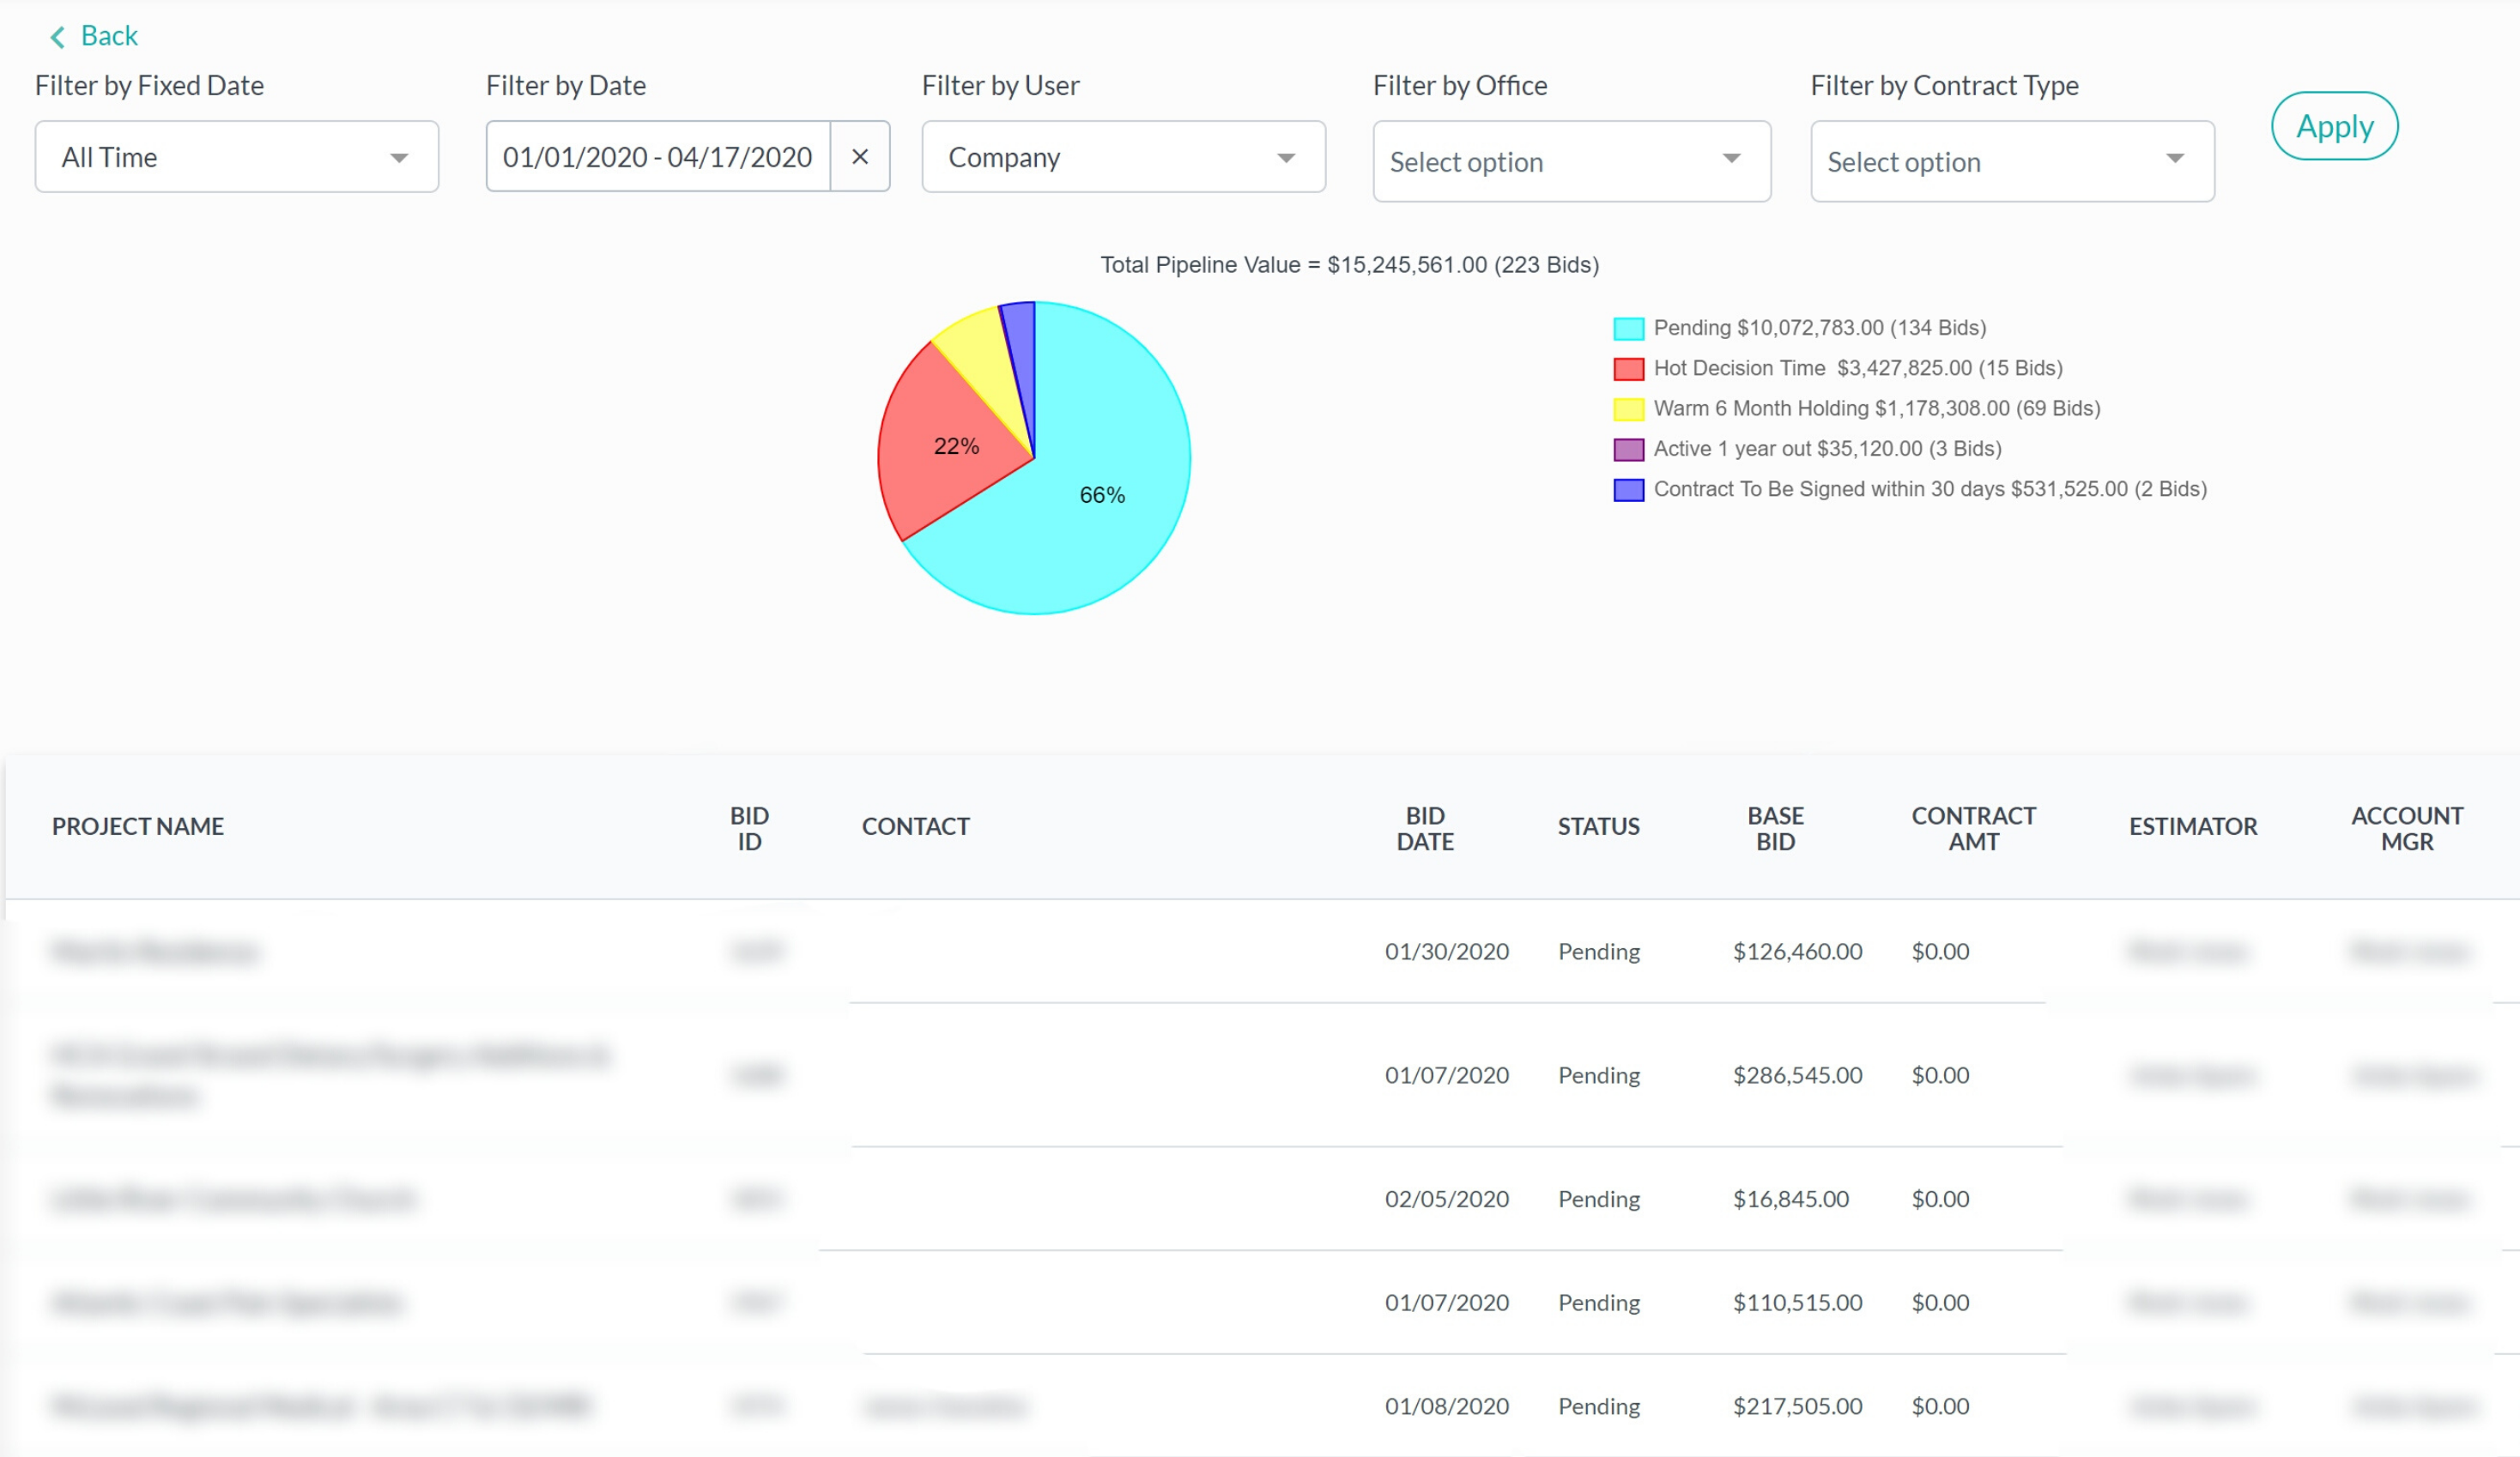
If you want to click into any of the areas of the pie chart, you have the option to do so. When you click on any of the categories, you will see a breakdown of the project. This is great to see which proposals are pending so you can individually follow up.
Next, if you scroll down, you can see we have the “bid volume” for each month and then you have the “contract volume.” The grey bar represents the quota and the green bar represents the bid volume that you did for each of those months. In the center, we have the capture contract volume you did against each of those months. To the right, we have the “sales behaviors,” which reflects the sales activities you check off in each project. These sales activities have time credits assigned to each item, and every time you check one of those activities off, the assigned time credit is reflected in this graph.
One important thing to consider is when you look at the closing ratio, you're looking at a one-year picture of everything that was bid and won or lost within that timeframe. So, if you bid a project from the previous year for $5,000,000, but close the deal this year, it will not contribute to your closing ratio pie chart because it does not fit the parameters of that bidding timeframe. The proposal delivery and contract date must be within that one-year timeframe for it to reflect in the closing ratio pie chart. However, it will contribute to your captured contracts from that month and you’ll receive that $5,000,000 credit. If you lose that $5,000,000 contract, it’s not going to contribute negatively to your timeframe in the pie chart either. Be sure to always check your dates and make sure your timeframe is accurate because if it doesn’t meet the parameters, it won’t show up on the chart.
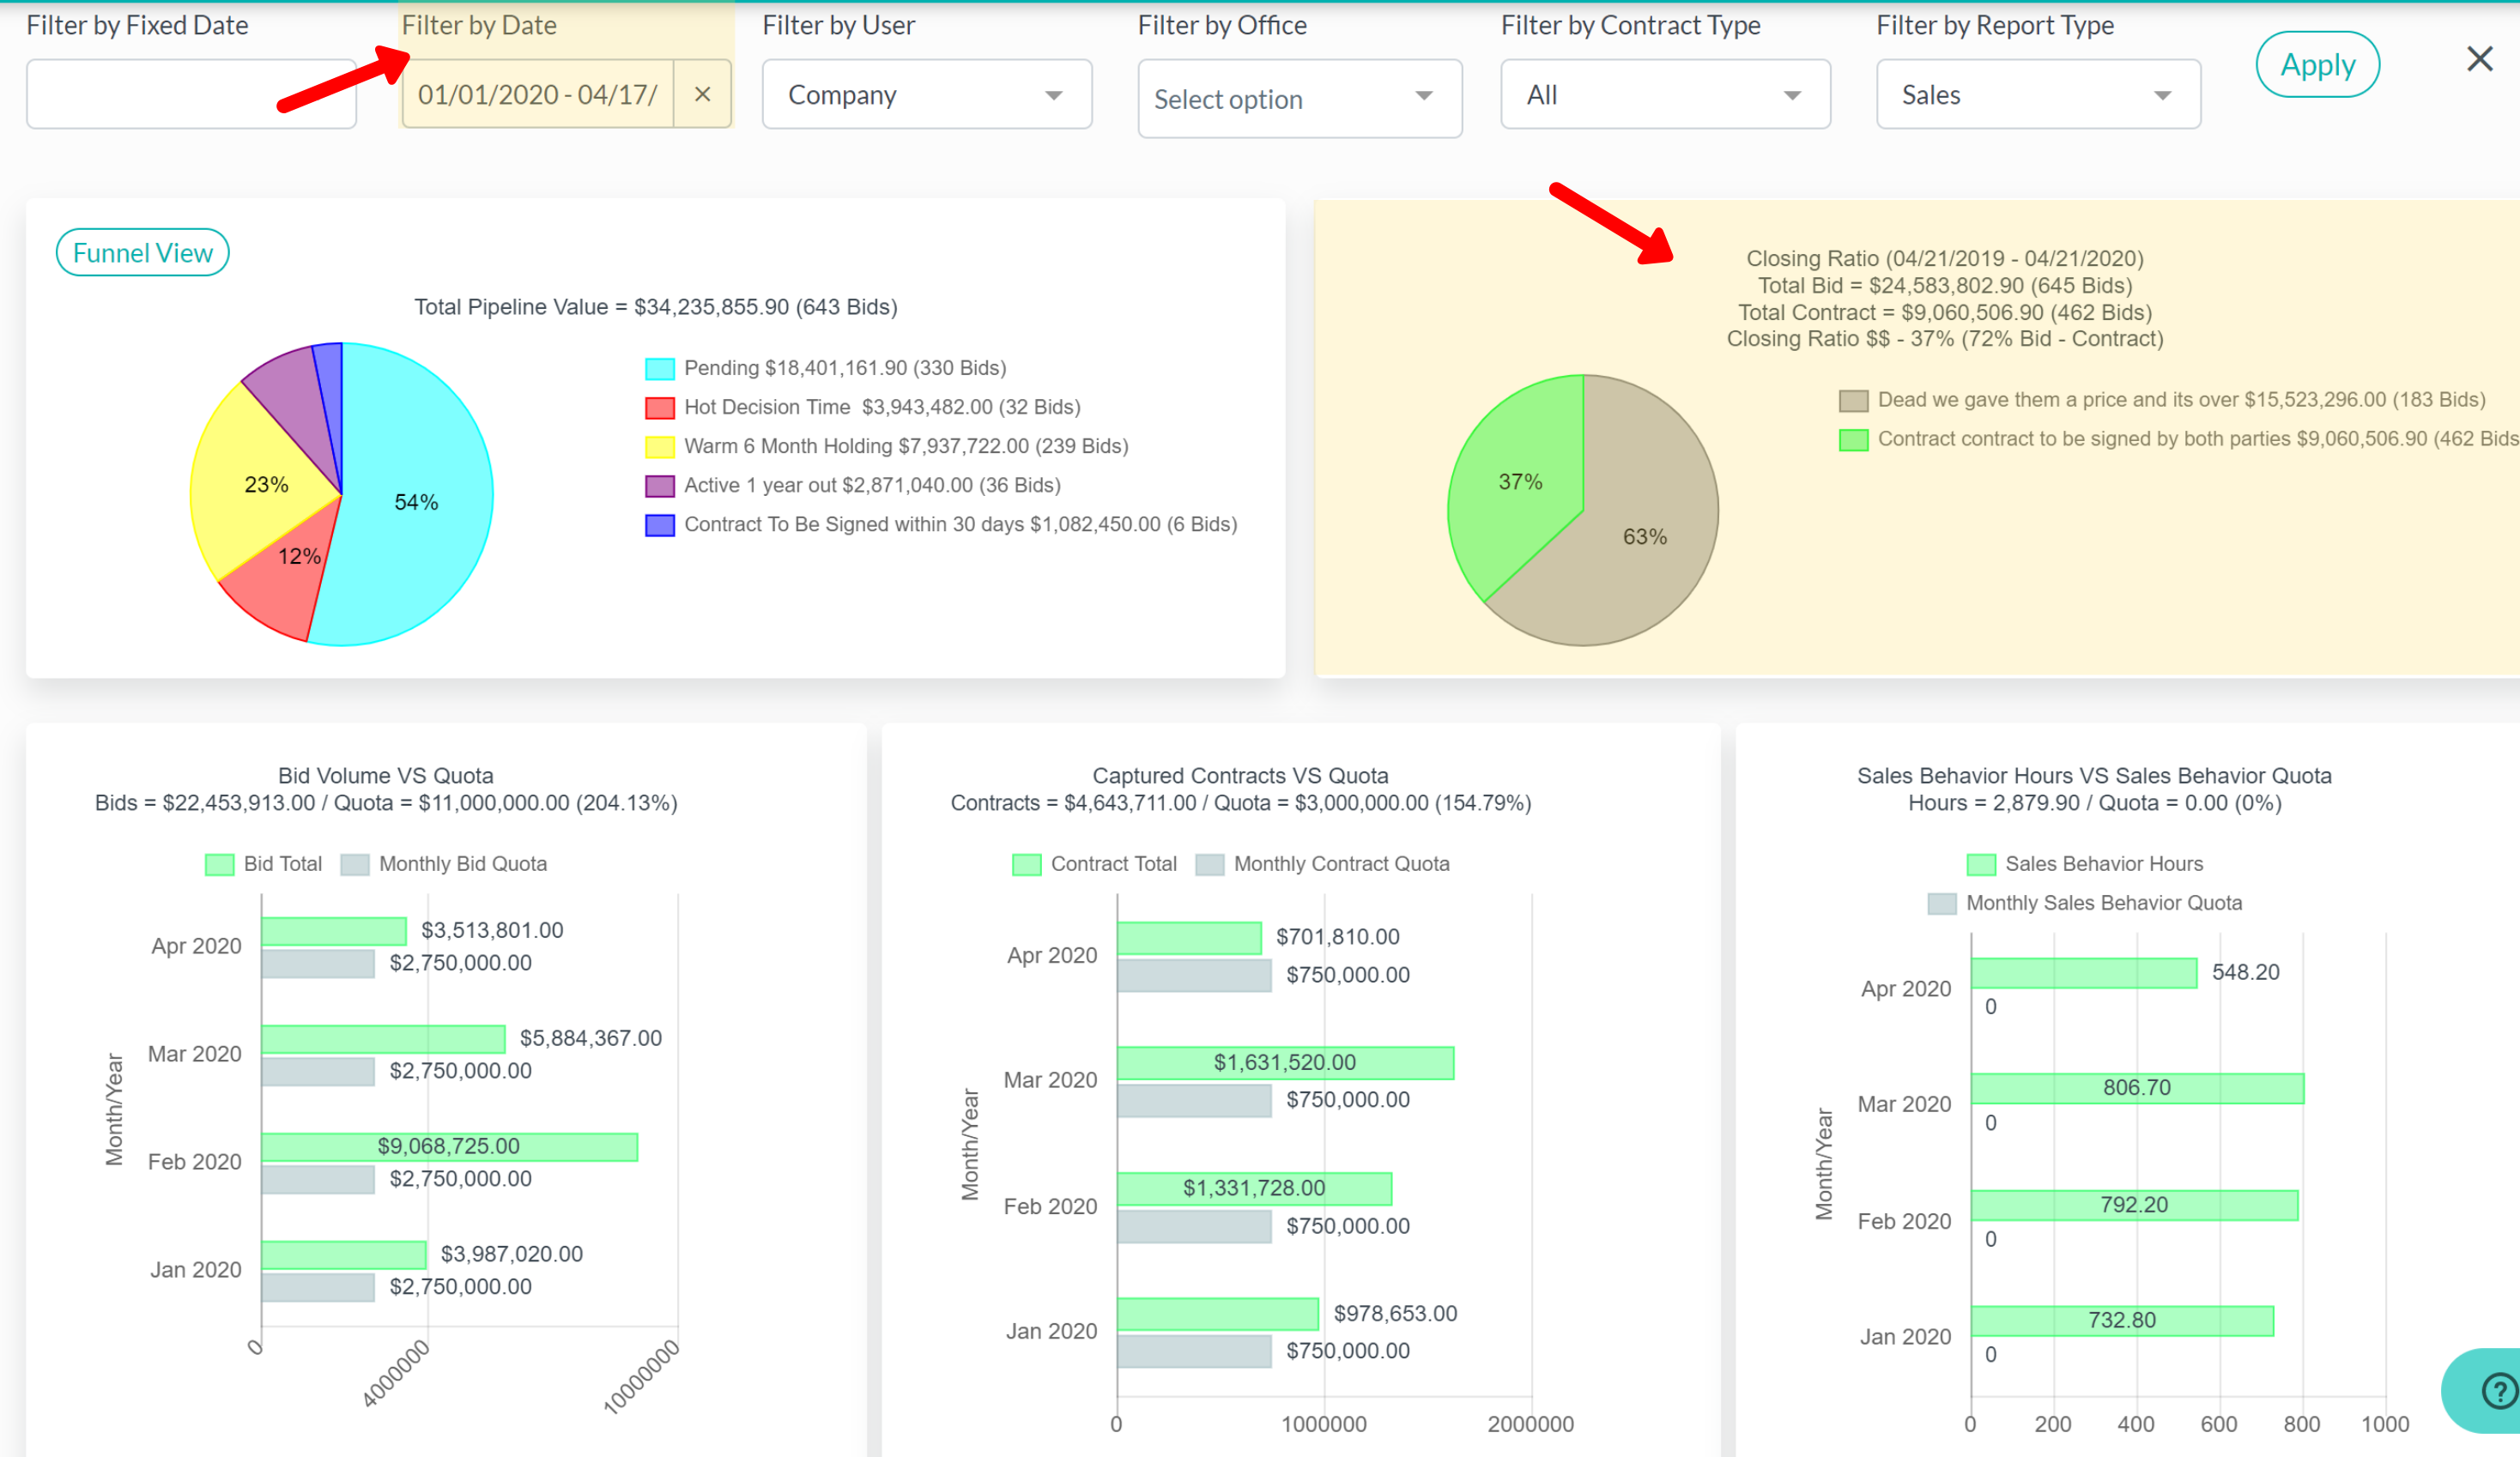
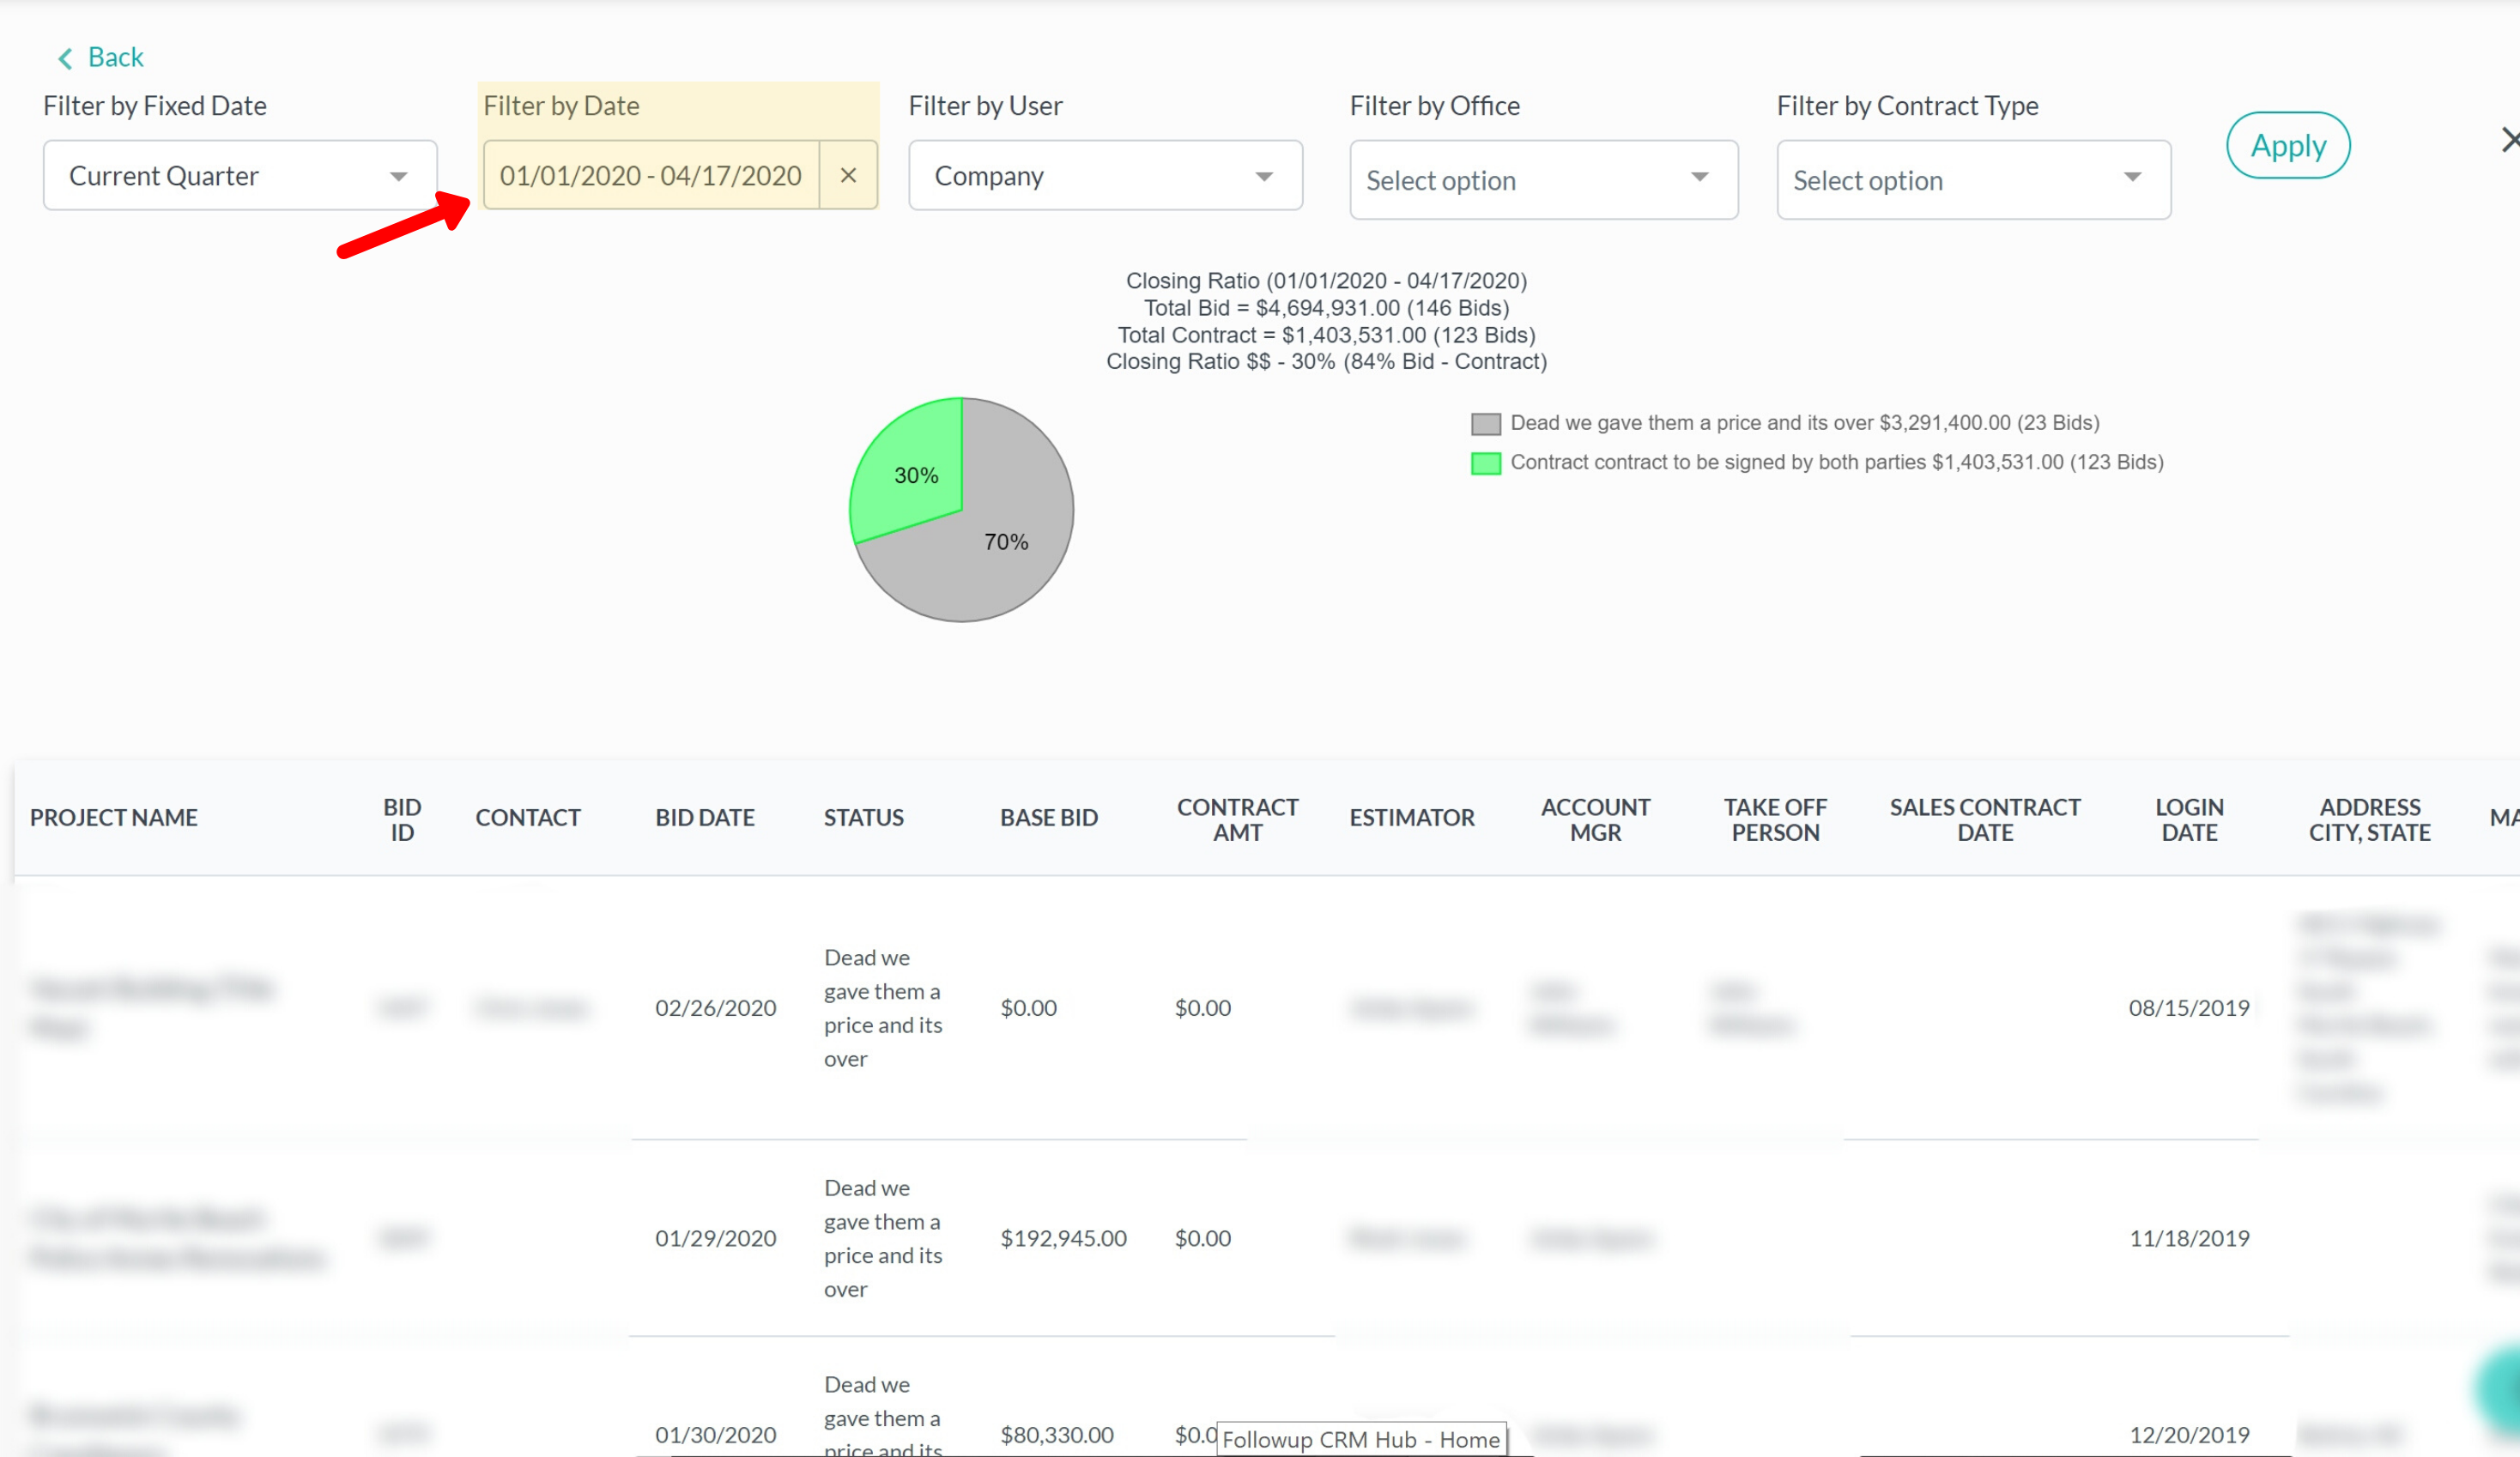
Next, we have a new feature that allows you to click into the closing ratio pie chart and adjust your date range. For example, if you want to see a two-year date range, you can do so by filtering the fixed date in the top left corner. This feature is great for our commercial contractors who like to see a wider closing ratio as the bidding process sometimes takes longer than a year to close.
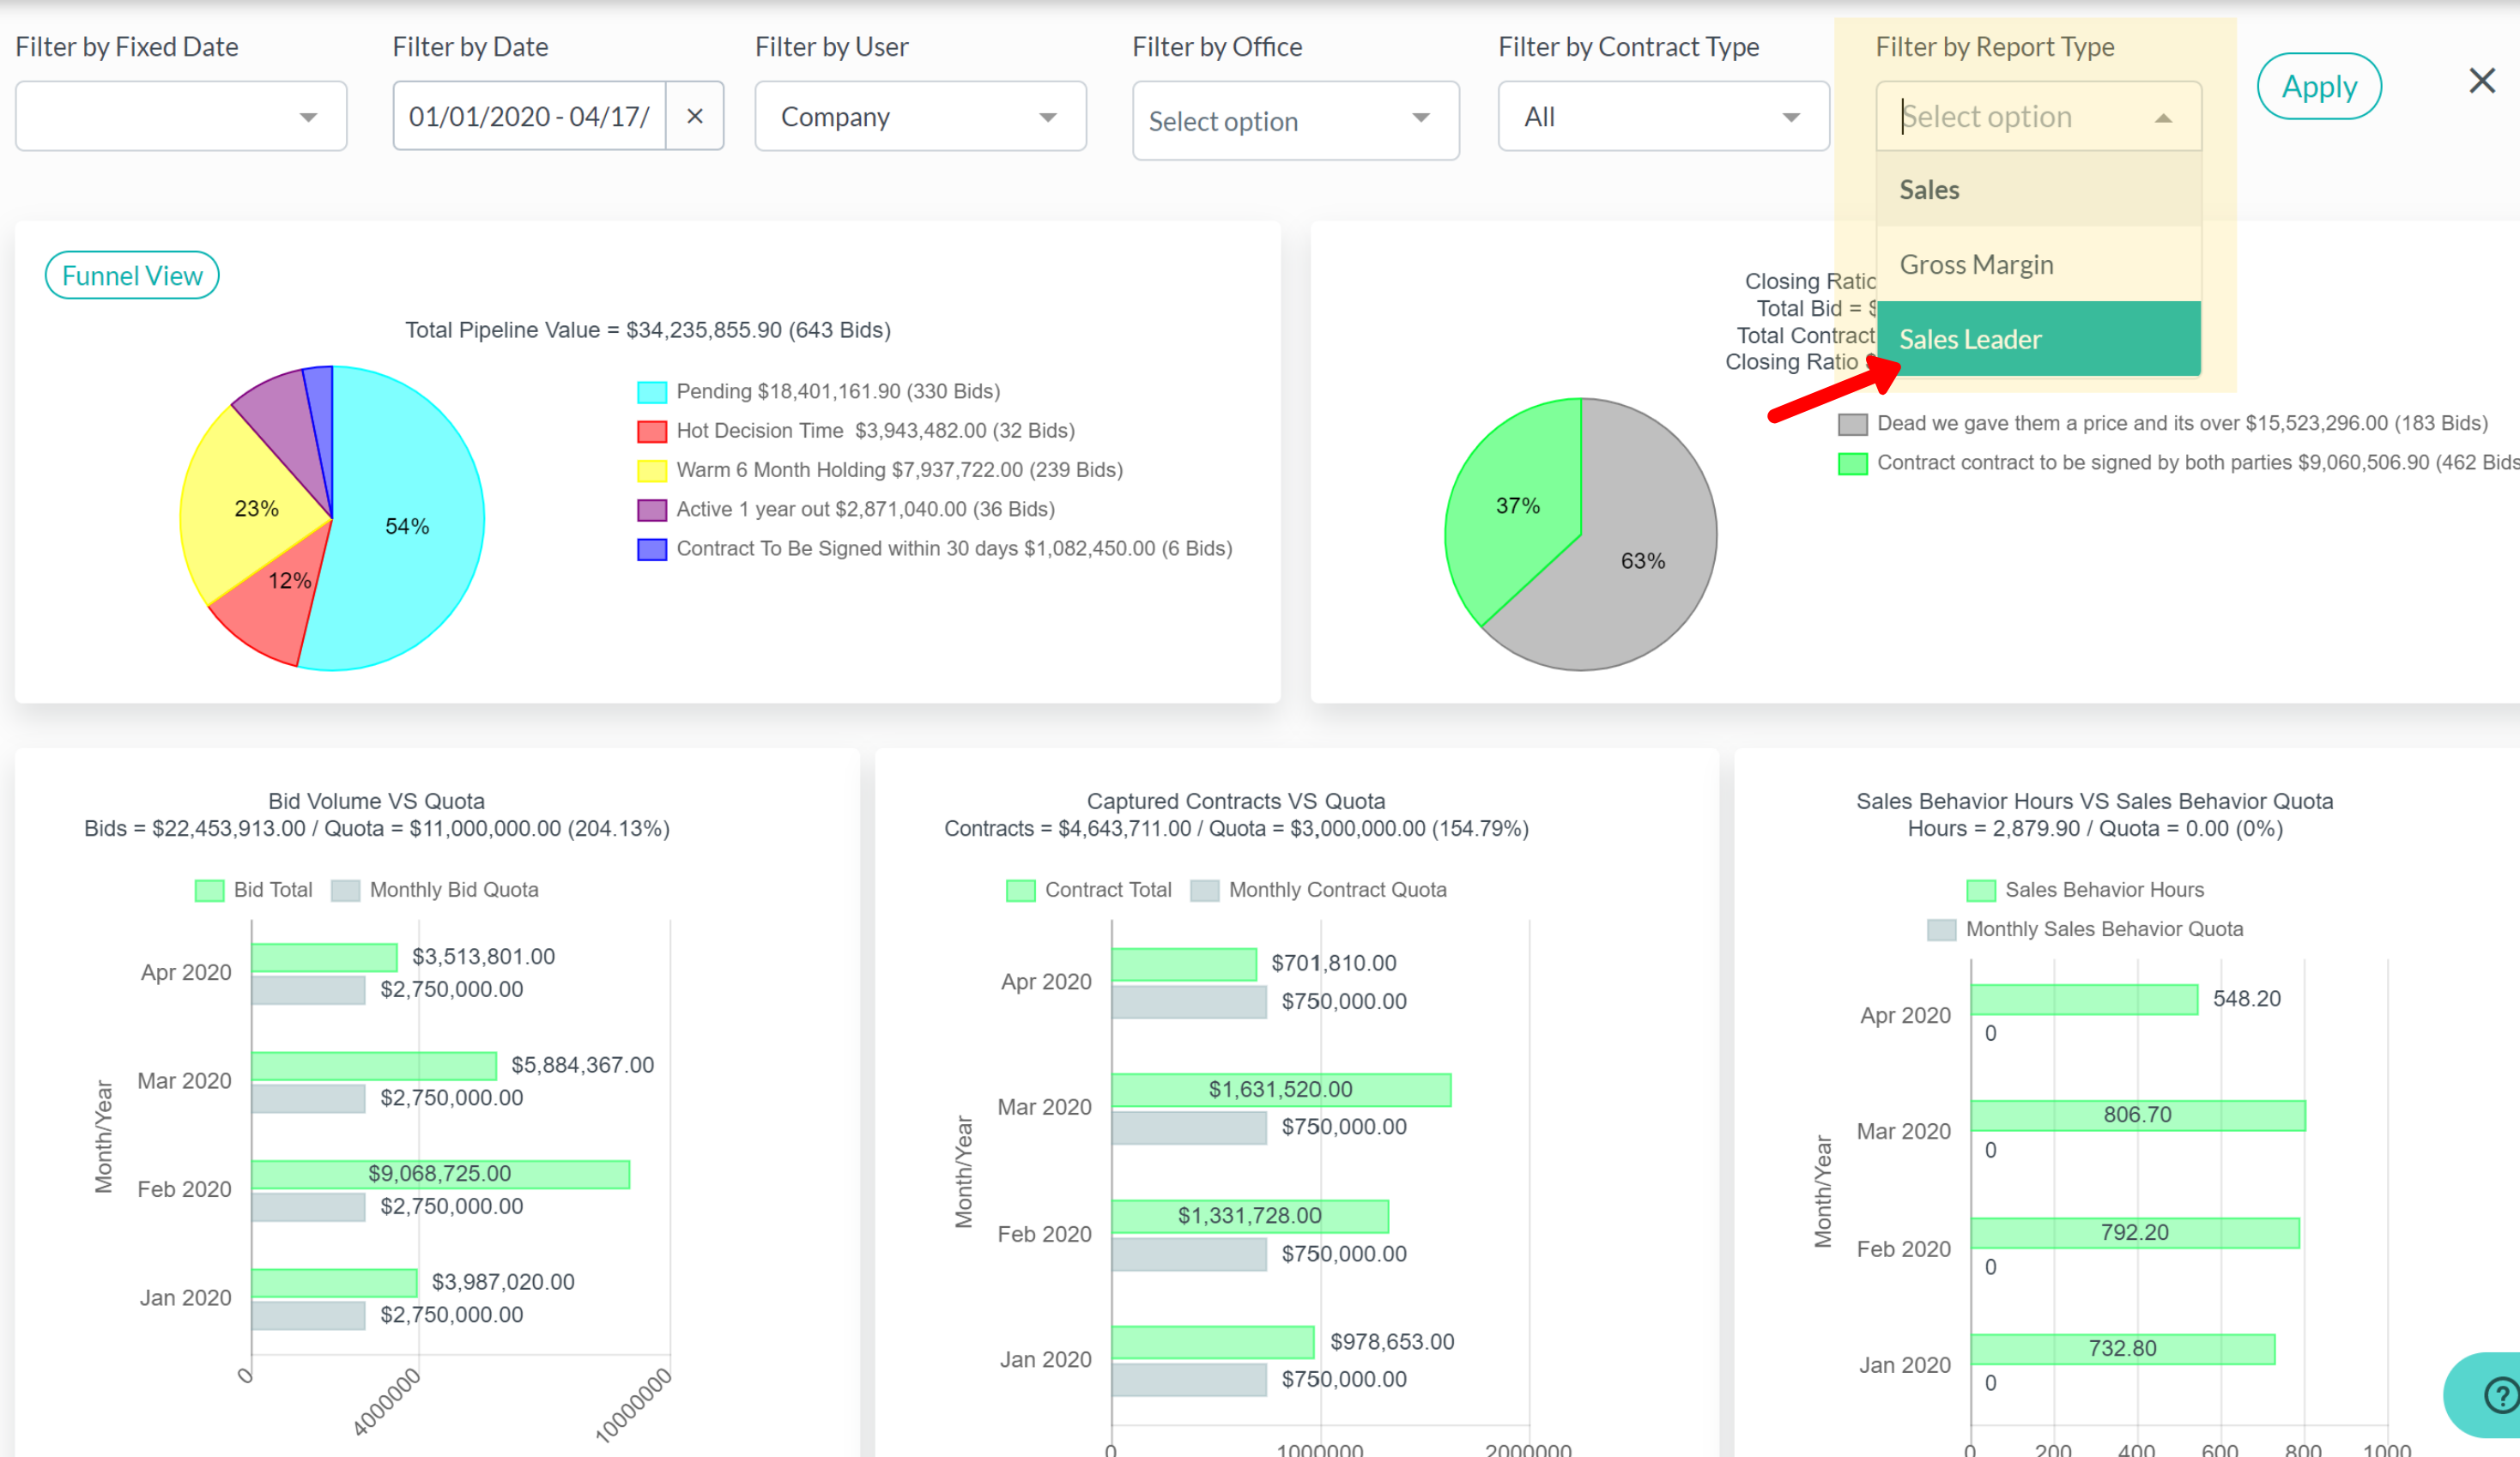
You can also use a filter to see the gross margin pipeline. The gross margin pipeline is the percentage of gross margin that you're going to receive on the jobs that are in the pipeline (a dollar percentage). For this to reflect on the homepage, you must fill out the gross margin percentage in the individual projects under “record details.”
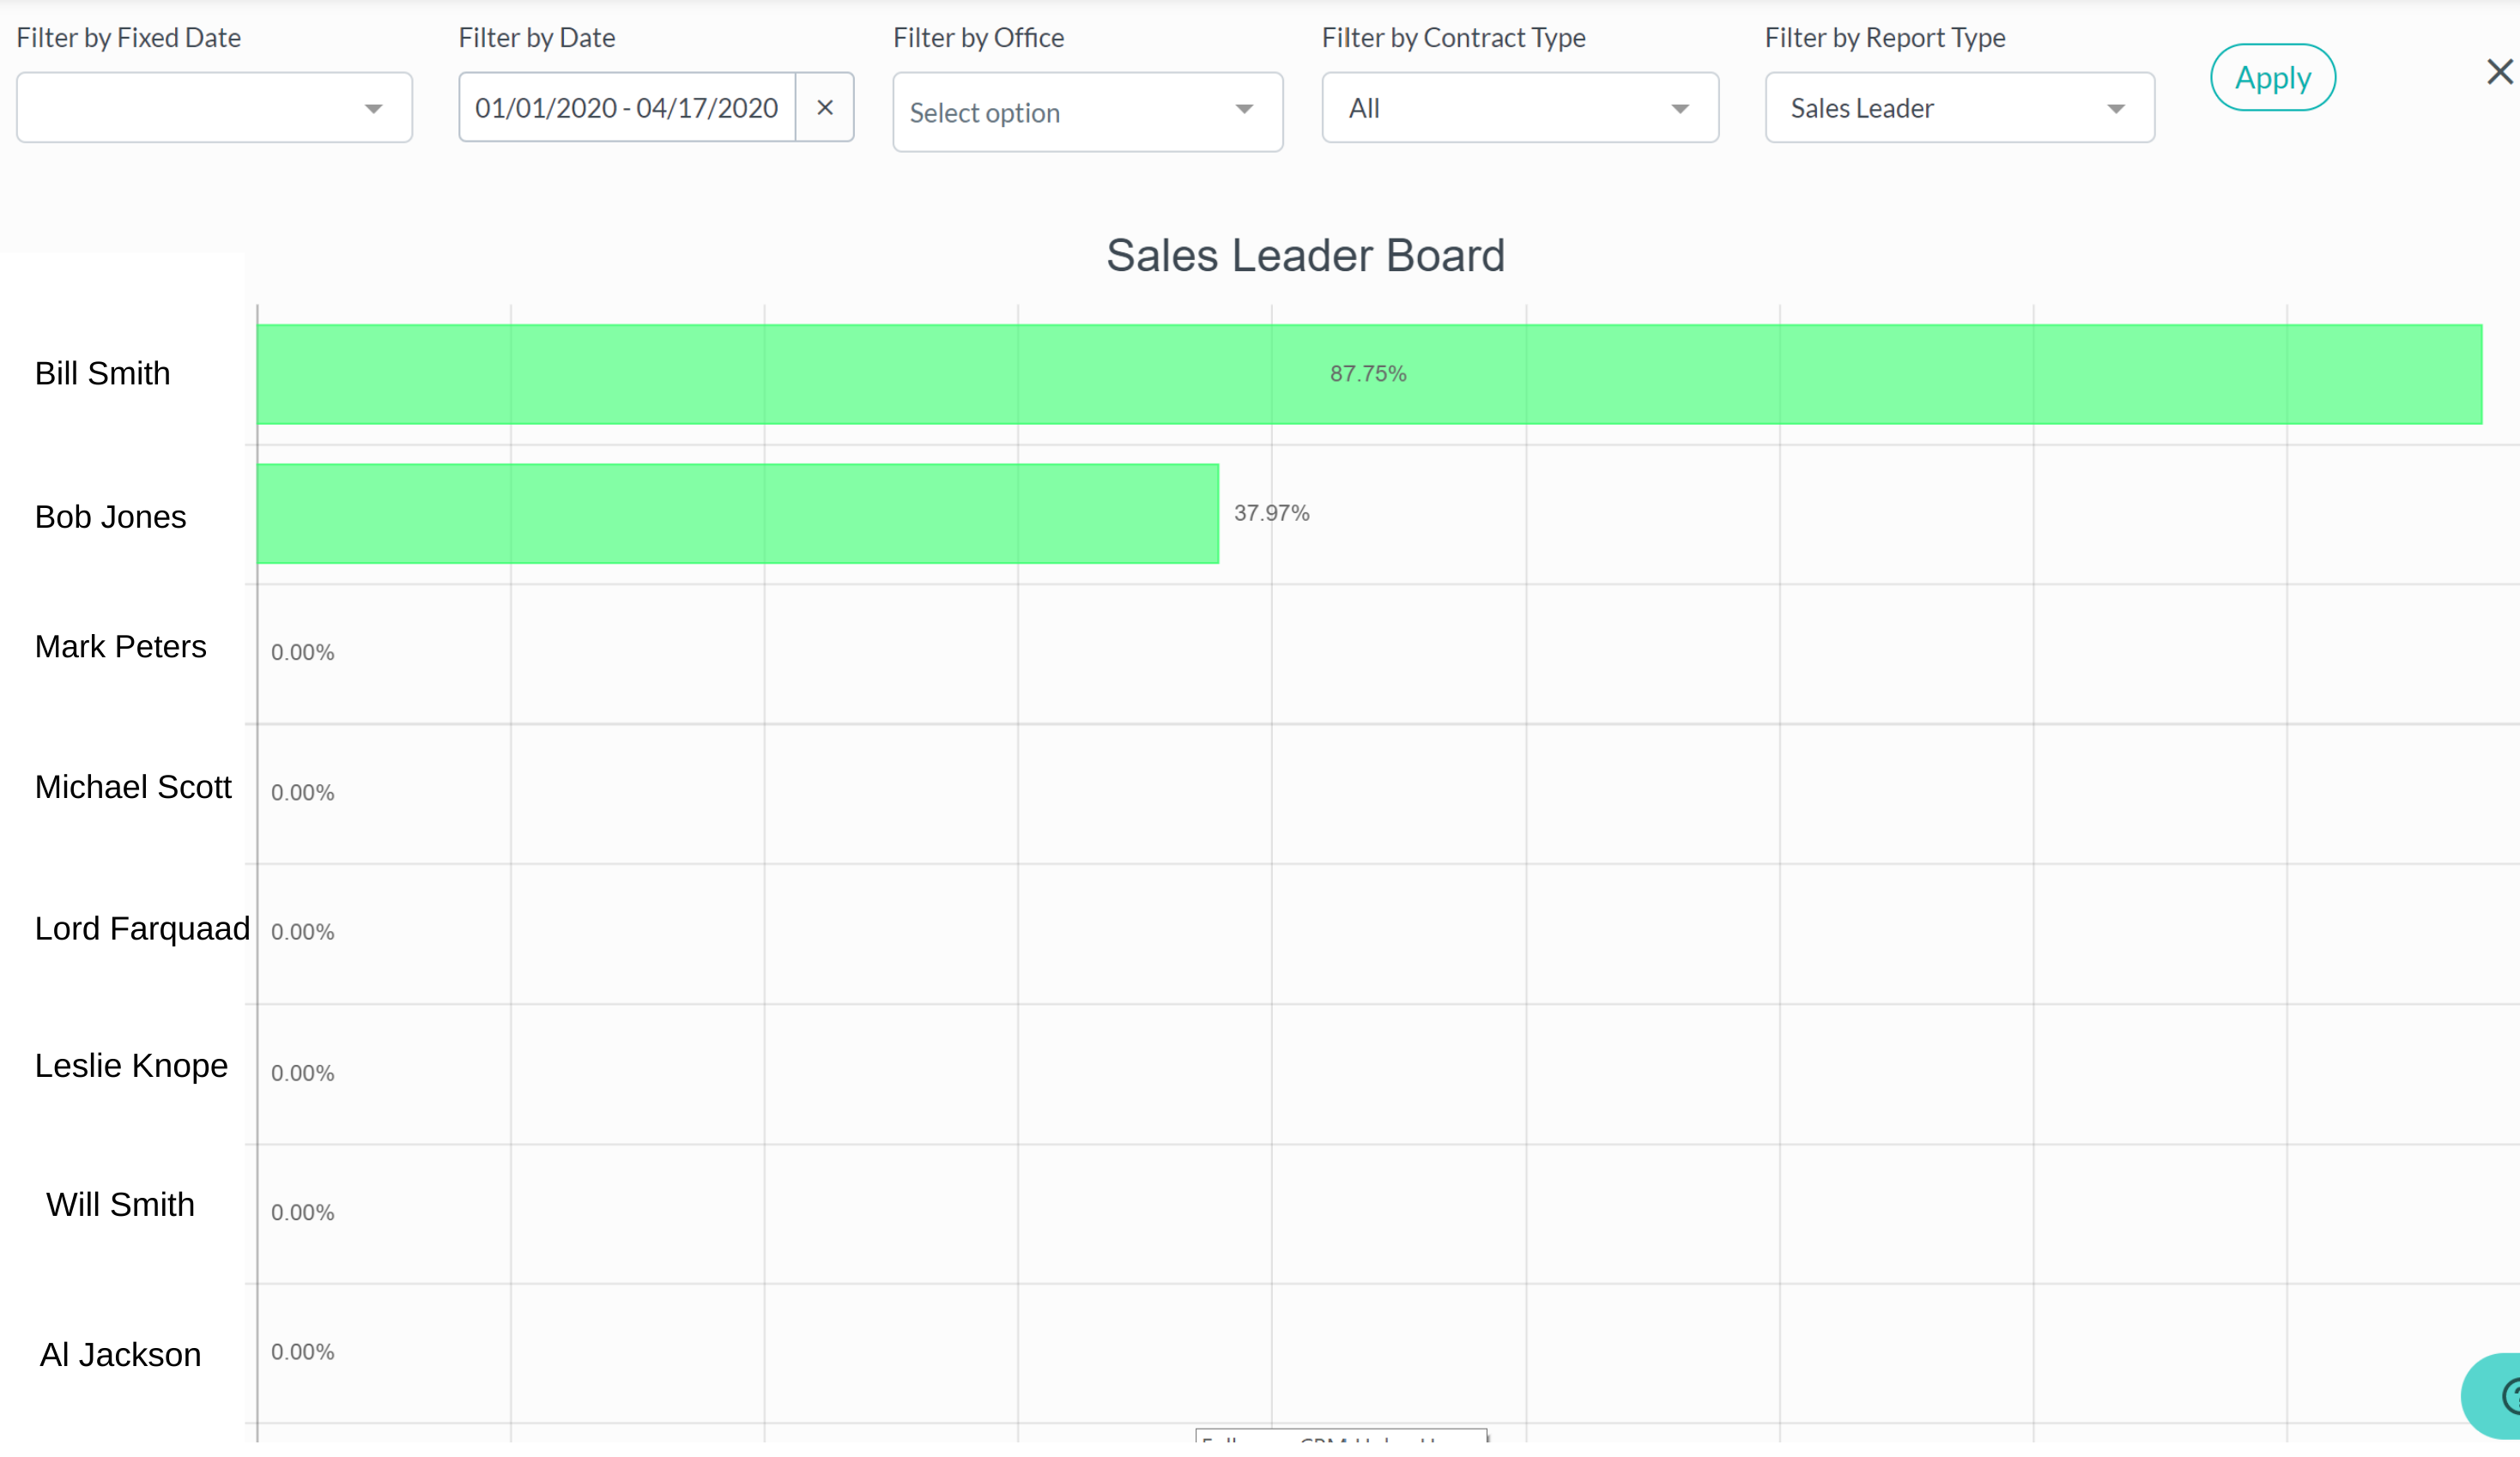
Last, you can filter by “sales leader” under “report type.” This is basically a score card that stacks your sales performance in order by percentage of quota that’s been completed by each individual sales rep.
 Did this answer your question?