Let's start here on the left-hand side, this is your pipeline.
This is your total pipeline of all time. As you can see I have Company selected, I'm seeing a full view of all of the dollars that have been bid out into the marketplace. Whether those are made up of active, hot, or cold bids. And then the number of bids total as well.
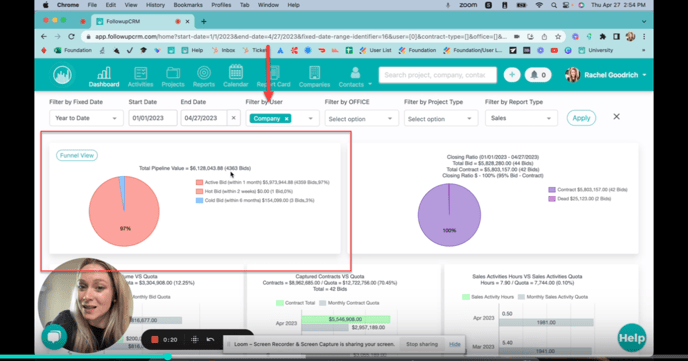
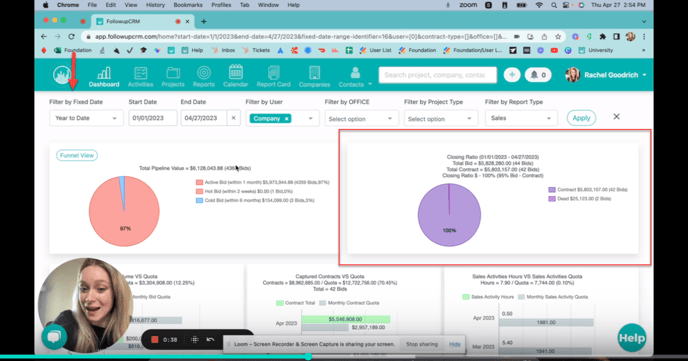
Then over here you see your Closing Ratio.
So this is your one versus lost and you will build up a percentage over time, you'll see the number of bids and the dollar amounts in each of those as well. This chart is affected and impacted by the Filter by Fixed Date.
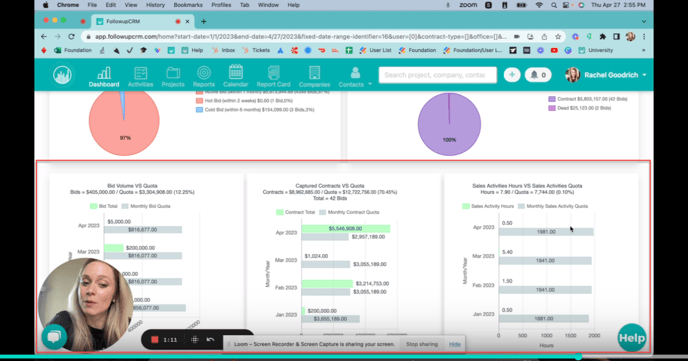
Finally, down here you've got if you have your Quotas. Quotas are goals loaded in for your team.
You'll see that with the gray bar and then the green bar, you may or may not have quotas in there, you'll see the green bar regardless. This is your total bids month over month. So, as you can see the green month over month and then the same.
Same thing for contracts. You'll see your total number of contract dollars month over month.
And your sales activity hours. These are the different sales activities that you have within a project page on the top right side, like your bids delivered, your follow ups, all of those things that you'll get credited for those productive sales activities. You'll be able to track those for yourself as well. You can see this for a company view or for yourself as a user. If I wanted to just see my own personal dashboard, I could take a look.
Happy Selling!
Need more help? Sign-up for additional Office Hours Training